Teaching Tip: NYC’s Potholes and Regression Analysis

potholeNew York is famous for many things, but one it does not like to be known for is its large and numerous potholes. David Letterman used to joke: “There is a pothole so big on 8th Avenue, it has its own Starbucks in it.” When it comes to potholes, some years seem to be worse than others. This winter was an exceptionally bad year. City workers filled a record 300,000 potholes during the first 4 months of 2014. That’s an astounding accomplishment.

But potholes are to some extent a measure of municipal competence–and are costly in many ways. NYC’s poor streets cost the average motorist an estimated $800 per year in repair work and new tires. There has been a steady and dramatic increase in potholes from around 70,000- 80,000 in the 1990s to the devastatingly high 200,000- 300,000 range in the most recent years. One theory is that bad weather causes the potholes, writes OR/MS Today (June, 2014). Using inches of snowfall as a measure of the severity of the winter, the graph on the left shows a plot of the number of potholes vs. the inches of snow each winter. (R-squared = .32).Pothole-analytics

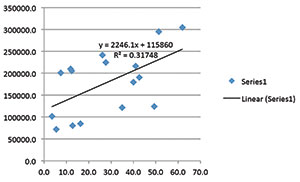
Research showed that the city would need to resurface at least 1,000 miles of roads per year just to stay even with road deterioration. Any amount below that would contribute to a “gap” or backlog of streets needing repair. The right-side graph shows the plot of potholes vs. the gap. With an R-squared of .81, there is a very strong relationship between the increase in the “gap” and the number of potholes. It is obvious that the real reason for the steady and substantial increase in the number of potholes is due to the increasing gap in road resurfacing.Pothole-analytics2

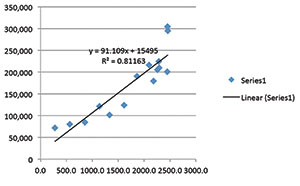
A third model performs a regression analysis using the resurfacing gap and inches of snow as 2 independent variables and number of potholes as the dependent variable. That regression model’s R squared is .91.

Potholes = 7801.5 + 80.6 * Resurfacing Gap + 930.1 * Inches of Snow

We are always looking for real-world, down-to-earth examples of forecasting models to share with classes. This may do the job!


OM in the News: Using Regression Analysis to Forecast Olympic Medals

olympicsHow many medals will the U.S. walk away with at this year’s Winter Olympics? What about perennial runner-up China? Two brothers, writes Fast Company (Feb. 7, 2014), have the answers. Since the 2010 Winter games, the two collected more than 30 datasets and ran regression after regression until they found a model that accurately matched the past two Winter Olympics.  According to Tim and Dan Graettingers’ model, the U.S. will walk away once more with the most overall medals, though it won’t come close to last Olympic’s record-setting 37 individual awards.  China, which only won 11 medals in the last Winter Games, is set to double its haul.

For the final model, the Graettingers found that only four variables consistently predicted a country’s medal count in the Olympics (with an R-squared of .585):

Geographic area – Their best guess is that it may reflect the nation’s population and/or the genetic diversity within the nation and/or the presence of mountain ranges on which to ski and snowboard.  Also, it does separate the relatively larger nations of the world from the many small (geographically and population-wise) island nations in the Caribbean and the Pacific.

GDP per capita –  It seems to confirm the hunch that nations whose people are affluent can afford to spend time pursuing excellence in sports, while poorer nations cannot.

Value of Exports – This measure of a nation’s total economic power seems to complement per capita GDP.

Latitude of Nation’s Capital –  The further your country is from the equator, the more snow and ice you’ll have – and the more medals you’ll win at sports contested on snow and ice.

By the way, no nation from Africa, South America, or the Middle East has ever won a medal at the Winter Olympic Games.  No nation from the Caribbean has either, despite the worthy efforts of the Jamaican bobsled team!

Classroom discussion questions:

1. What are the strengths and weaknesses of this model?

2. How accurate were the brother’s forecasts when the final 2014 tally was completed at the end of the games? (Here is a link to their country by country forecasts).

Video Tip: Forecasting at Hard Rock Cafe

It’s hard to motivate students about how important forecasting is in OM with common examples like IBM’s stock price, Dell sales, or housing starts. So in Ch.4 we have two tools to help set the stage. The first is the Global Company Profile featuring Disney World.  Disney does detailed daily, weekly, monthly, annual, and 5-year forecasts of park attendance, with a staff of 35 analyzing a whole flock of interesting variables. The second tool is the 8-min. video case study we created on how Hard Rock Cafe uses forecasting.

Students like the Hard Rock video not only because the company is “cool”, but because the applications of moving averages and regression are clever and thoughtful. For example,  multiple regression is used to estimate the price elasticity of each menu item. Hard Rock is able to estimate the impact of a $1 price increase of cheeseburgers on sales of chicken sandwiches and margaritas.

The weighted moving average technique is used to set sales and bonus targets for store managers. The company also uses exponential smoothing and other models to forecast daily sales/food needs, purchasing needs, and borrowing needs. A good lead-in to the video is to ask students what they think Hard Rock needs to forecast with mathematical models.