Guest Post: Quality Management in Services

Prof. Howard Weiss, retired from Temple U., shares his thoughts monthly.

A recent issue of The Philadelphia Inquirer presented two compelling examples of quality management—or, more accurately, lapses in quality management—within the service sector. These cases illustrate the difficulty of applying quality principles to both healthcare and transportation.

Virtua Hospital. Two newborn infants were mistakenly brought to the wrong mothers. Each mother breastfed the wrong child before the error was discovered. The nurse who identified and reported the mistake to her supervisors was subsequently terminated. Hospital administrators justified the dismissal by claiming the nurse had failed to check infant ID bands at the beginning of her shift. The nurse stated she had never been informed of such a policy.

Your Heizer/Render/Munson text notes in Chapter 6 there should be “Employee empowerment: When employees see a problem, they are trained to take care of it.” This nurse did take care of the problem. Reporting it should have led to continuous improvement in the ward rather than her being fired. The result of firing an employee who reports a problem will mean that fewer employees will report problems. This, of course, undermines quality improvement.

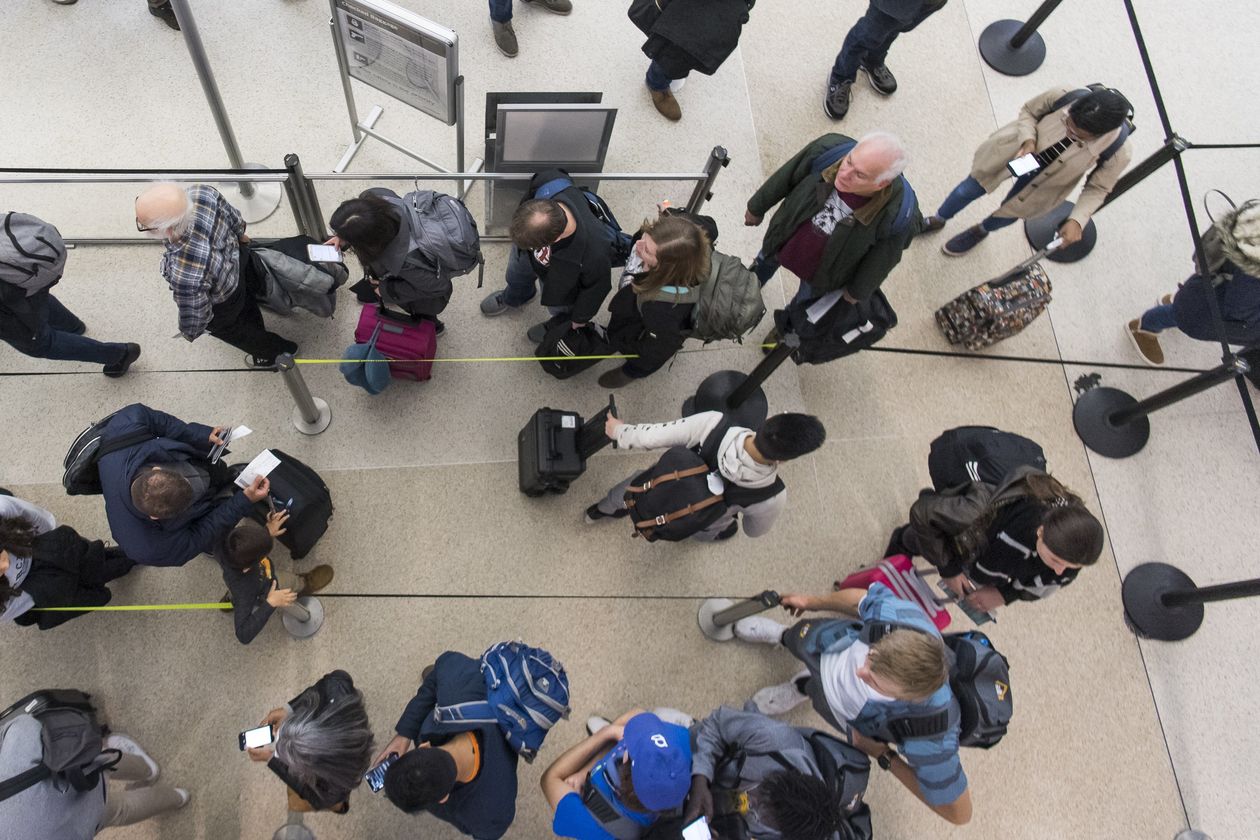
Philadelphia International Airport (PHL).  PHL ranked last in customer satisfaction among the 27 Large airports that serve 10-33 million passengers per year–the 5th consecutive year it was at the bottom of the rankings.


Chapter 6 notes that “The personal component of services is more difficult to measure than the quality of the tangible component.” Nevertheless, J.D. Power evaluates airports on a range of specific, measurable factors including facilities, services, and customer experiences.

Management of PHL is fully aware of the airport’s shortcomings and has taken steps to improve by adding new bathrooms, new restaurants and a customer service training program. Plans are also underway to improve the rail platforms, seating, carpeting and roadway signage. However, these improvements will not fix the major problem. The airport is too small and too old and there is no room to expand it. One other factor to consider is that unlike with products, the passengers at PHL may not have other choices for which airport to use.

Classroom discussion questions
1. Does your employer encourage the reporting of problems/ mistakes?
2. Why might passengers at PHL not have other options? (Hint-check out American Airlines).

OM in the News: Do You Hate Waiting in Line?

Conventional wisdom says that the fastest-moving line is a single “pooled” line. We have long subscribed to this mathematical approach with Models A and B in Module D, Waiting Line Models in our OM text. But a new study, reported in The Wall Street Journal (Oct, 26, 2020), just found that splitting the pool into individual lines made them move faster.

The researchers looked at patient wait times and length of stay in the ER of a California hospital. They found that when the hospital switched from a pooled line to a dedicated-queue system in which patients were assigned to a specific doctor, average wait times decreased 9% ( by 39 minutes) and lengths of stay decreased 17%.

Single lines may not be the fastest in knowledge-intensive fields.

With a dedicated-queue system, physicians could see who they were helping, who in the waiting room had been assigned to them and exactly how long their individual queue was. The doctors seemed to feel more ownership when they could see which and how many patients were assigned to them.

But would service providers in other industries behave the same way as? The study concluded that a dedicated queue would also speed up wait times in fields that are knowledge-intensive and have high levels of customer ownership, such as medicine, personal banking or places like the Apple Genius Bar.

“The phenomenon is not expected to translate to anonymous call centers or other settings where the service provider doesn’t have a relationship with the customer or the service is very routine, like at a grocery checkout or a factory with machines,” says one of the researchers in a forthcoming article in the journal Operations Research. “Companies may want to look at their organizational culture, seeing where there is room to encourage more customer ownership, and consider ways to change to a dedicated-queue configuration to achieve shorter wait times. Encouraging customer ownership by dedicating assignments to each server when planning queue configurations might shorten the wait and service time.”

Classroom discussion questions:

  1. Explain the difference between Models A (M/M/1) and B (M/M/s).
  2. What model is being described in this study?

OM in the News: The High Cost of Long ER Waits

Crowded emergency rooms have long been a problem in the U.S., writes The Wall Street Journal (June 9, 2020),  In our discussions of queuing theory in Module D, we typically focus on the many attributes of the waiting line–length, time, cost–and on occasion we add the cost of adding multiple servers. However, a recent study by a S. Carolina prof shows that when a new ER opens, crowding at nearby facilities instantly falls an average of 10%. When comparing mortality rates at the older ERs before and after the change, the research found that a 10% drop in patient volume leads to a 24% reduction in mortality rates in the first 30 days and a 17% reduction over 6 months.

In ERs across the U.S., many patients wait for hours to be seen, and about one in 50 leaves before receiving treatment. ER patients awaiting admission to the hospital often have to wait in hallways on gurneys, while ambulances may be turned away from busy facilities. Researchers have long sought to quantify these costs of crowding.

The drop in mortality rates could be attributed to fewer people leaving against medical advice. Ten percent less patients in the ER reduced the number of patients walking out by about 51%. That is important because about 46% of people who leave the ER without being seen still need immediate medical attention. In fact, 11% are hospitalized in the next week. Since patients often come back for care soon after they leave, that could help explain why the drop in mortality rate was most significant in the first 30 days.

The study also examined whether the drop in patent volume affected “boarding”—that is, when patients wait on stretchers, sometimes for hours, before being admitted into the hospital. But patients from the ER tend to generate less profit and consequently often have to wait anyways for beds, so the study concluded that boarding is not impacted by ER crowds.

Classroom discussion questions:

  1. Why is this study important?
  2. What OM issues are faced on a daily basis in ERs?

OM in the News: Meet Zora, The Robot Caregiver

This is Zora. It may not look like much — more cute toy than futuristic marvel — but this robot is at the center of an experiment in France to change care for elderly patients. When Zora arrived at this nursing facility near Paris, a strange thing began happening: Many patients developed an emotional attachment, treating it like a baby, holding and cooing, giving it kisses on the head. Zora offered companionship in a place where life can be lonely. Families can visit only so much, and staff members are stretched. Patients at the hospital have dementia and other conditions that require round-the-clock care.

Zora often leads exercises and plays games. It can have a conversation because the nurse (out of view) types words into a laptop for the robot to speak.

Zora doesn’t dispense medicine, take blood pressure or change bedsheets, but its Belgium-based provider has sold over 1,000 of the robots (at $18,000 each) to health care facilities around the world. In nearly every country, the population of older adults is rising. The number of people over 60 will more than double to 2.1 billion by 2050.

There simply won’t be enough people for the required health care jobs, so new technology must be created to help fill the void, writes The New York Times (Nov. 27, 2018). The challenge is particularly acute in France, where hospitals have been facing a national crisis, with health care professionals striking and protesting budget cuts and staff shortages. In Australia, a hospital using a Zora found that it improved the mood of some patients, and got them more involved in activities. And patients have told the robot things about their health they wouldn’t share with doctors.

Classroom discussion questions:

  1. What can and can’t Zora do?
  2. Where else can “service robots” make their mark?

OM in the News: Why Hospital ER Wait Times Are Often Wrong

Driving down the highway, you’ve undoubtedly seen a new kind of digital sign advertising local hospitals. “Current wait 5 minutes,” they say, with the wait time updating in real time to reflect the current conditions in the ER. It’s an effective form of advertising, and it gives consumers a sense of transparency about making the choice to go to the ER. Yet if you head to that nearest ER, don’t be surprised if you end up waiting longer than the sign says. “The truth behind these numbers is that they’re often wrong,” according to Insights by Stanford Business (Aug., 2017). Looking at the ERs of 4 LA hospitals and testing the effectiveness of the method for estimating wait times, the study by Stanford U. professors found the method extremely unreliable in all cases–off by as much as 1.5 hours. Drawing on queuing theory, a new model, Q-Lasso, was able to cut the margin of error by as much as 33%.

The trouble with most wait time estimates is that the models these systems use are often oversimplified compared to the complicated reality on the ground. One of the most common ways of arriving at a wait time estimate is to simply give a rolling average of the time it took for the last few patients to be seen. This works well if every patient is the same, they arrive at a steady rate, and all of their ailments take the same amount of time to diagnose and remedy. But that’s rarely the case in the real world.

So the researchers came up with a large number of potential factors to look at. Q-Lasso would then select the best of them from the data. For example, it was initially assumed that the number of nurses working would be an important criterion for assessing wait time. But the data showed this was mostly irrelevant. Q-Lasso could provide wrong times, but the model tended to overestimate wait times, rather than underestimate them, making the experience more acceptable.

Classroom discussion questions:

  1. Why are advertised wait times often wrong?
  2. Describe the Q-Lasso model.

OM in the News: Hospital Checklists and TQM

“Surgery checklists save lives,” reports The Washington Post (April 18, 2017). Hospitals in South Carolina that completed a statewide program to implement the WHO’s Surgical Safety Checklist had a 22% reduction in post-surgical deaths. The study, to appear in the August 2017 issue of Annals of Surgery, is one of the first to show a large-scale impact of the checklist on the general population.

Surgical care requires careful coordination of a variety of skilled health-care providers in a complex infrastructure using specialized tools. “Safety checklists are not a piece of paper that somehow magically protect patients, but rather they are a tool to help change practice, to foster a specific type of behavior in communication, to change implicit communication to explicit in order to create a culture where speaking up is permitted and encouraged and to create an environment where information is shared between all members of the team,” said the Harvard Medical School prof directing the study.

A total of 14 hospitals completed the program, representing 40% of the total inpatient surgery population in the state. Researchers compared the 30-day post-surgery mortality results between the checklist hospitals with those of the rest of the hospitals in the state. The report includes major inpatient surgical procedures from various specialties, such as neurological, cardiac and orthopedic surgery.

The 19-item checklist encourages surgical teams to discuss the surgical plan, risks and concerns. Most of the items are simple, such as “does the patient have a known allergy” or “is essential imaging displayed.” Following surgery, patients are at risk of complications and death from a variety of causes, such as infection and organ failure. The checklist ends with a requirement for a conversation among the surgeon, anesthetist and nurse about the patient’s recovery and management plan. As a whole, the checklist items create an operating room communication culture that improves overall surgical care and safety before, during and after an operation.

Classroom discussion questions:

  1. What other tools described in Chapter 6 could be used in operating rooms to improve quality?
  2. Why are checklists so valuable? What other industries use them regularly?


OM in the News: Johns Hopkins’ Capacity Command Center

Johns Hopkins Hospital’s state-of-the-art, advanced hospital control center

Johns Hopkins Hospital, reports Analytics Magazine (Jan.-Feb., 2017), recently launched an advanced control center to better manage patient safety, experience, volume, and the movement of patients in and out of the hospital. The Capacity Command Center incorporates systems engineering principles, which are commonly seen in aerospace, aviation and power industries, but are rare in hospitals.

In the one room center, 24 staff members work together, equipped with real-time and predictive information, and empowered to take action to prevent or resolve bottlenecks, reduce patient wait time, coordinate services, and reduce risk. The command center also houses a sophisticated system with a wall of computer monitors that provides situational awareness and triggers the center team to take immediate action. During a typical afternoon, the system receives about 500 messages/minute from 14 different hospital IT systems generating real-time data. “In the past, like most hospitals, we were dependent on traditional technology – phones, email and IT systems – to manage the hospital, assign beds, etc.,” says a hospital exec.

The technology in the command center keeps staff members informed 24/7 about when there is an influx of patients coming into the hospital, which hospital units need additional staff members, the status of how many patients are being treated, the need for and availability of beds across the hospital, the highest-priority admissions and discharges, and other essential information.

Early results demonstrate improved patient experience and operational outcomes such as: (1) 60% improvement in the ability to accept patients with complex medical conditions from other hospitals; (2) critical care team is now dispatched 63 minutes sooner to pick up patients arriving in ambulances from other hospitals; (3) patients are assigned a bed 30% faster from the ER; (4) transfer delays from the OR after a procedure have been reduced by 70%; and (5) 21% more patients are now discharged before noon.

Classroom discussion questions:

  1. Why have hospitals been slow to adopt these process control procedures used in other industries?
  2. What hospital functions could benefit from the command center concept?

OM in the News: Hospitals Printing 3-D Hearts to Help in Surgeries

A 3-D printed model shows cross sections of a child's heart
A 3-D printed model shows cross sections of a child’s heart

The night before operating on 2-year-old Myla Kramer, her surgeon held a copy of her heart, produced on a 3-D printer, in his hands. He studied it, trying to determine how to patch the many Swiss-cheeselike holes in the bottom of her heart — a potentially life-threatening condition. The next day, he knew exactly what to do. The surgery was a success, and Myla is thriving.  Without the 3-D printed heart, said Dr. Mark Plunkett, “There was a significant possibility that I would get in there, try to patch over this area, and not necessarily get all of the holes.”

Congenital heart defects are problems with the structure of the heart at birth. They’re the most common type of birth defect, affecting 8 out of every 1,000 newborns. The printed hearts can help doctors in tricky cases such as Myla’s, writes the Chicago Tribune (Oct. 23, 2016). Engineers typically take an MRI or CT scan of a patient’s heart and run the scan through computer programs that allow them to print plaster composite hearts in 3 dimensions. The process for Myla took 2 days at the R&D arm of the OSF HealthCare Hospital in Peoria. Jump’s 3-D printer cost $80,000.

With use of 3-D printed heart models expected to grow, OSF (a chain of 10 Illinois hospitals) and the National Institutes of Health (NIH) are partnering with the American Heart Association to improve the quality of printed hearts, with the goal of helping more patients. The groups want to create an online database of 3-D printed hearts from patients with congenital heart defects, reviewed by experts in the field. The idea is to help standardize the process of printing hearts. Practitioners, medical students and others would be able to download the models at no charge and print them or view them in 3-D using virtual reality tools. The Tribune article also links to a 50 second video describing the process.

Classroom discussion questions:

  1. How else can 3-D printing be used in medical care?
  2. How are manufacturers now using the technology?

OM in the News: A Stopwatch in the Operating Room?

stopwatchMost businesses know the cost of everything that goes into producing what they sell — essential information for setting prices.  “Medicine is different. Hospitals know what they are paid by insurers, but it bears little relationship to their costs”, writes The New York Times (Sept. 8, 2015). Now, thanks to a University of Utah project, its hospital is getting answers, information that is not only saving money but also improving care. The cost issue has taken on new urgency as the U.S. accelerates the move away from fee-for-service medicine and toward a system where hospitals will get one payment for the entire course of a treatment, like hospitalization for pneumonia.

The linchpin of Utah effort is a computer program with 200 million rows of costs for items like drugs, medical devices, a doctor’s time in the operating room and each member of the staff’s time. The hospital has been able to calculate, for instance, the cost per minute in the emergency room (82 cents), the surgical intensive care unit ($1.43), and the operating room for an orthopedic surgery case ($12). With such information, as well as data on the cost of labor, supplies and labs, the hospital has pared excess expenses and revised numerous practices for more efficient care. Harvard’s Michael Porter called the accomplishments “epic progress.”

The hospital began by looking at how much supplies cost — bandages, sutures, medications. Then it started tracing use of those items to individual patients. It added in labor costs, a more complicated question. Porter told the hospital to go into rooms with a stopwatch and time how long each staff member spends on each procedure and with each patient.

With its software, the hospital is also finding simple ways to improve outcomes and reduce costs. When doctors looked at their costs per day, they were stunned to see how much they were spending on lab tests. Each was cheap, $10-$20, but the total bill came to about $2 million a year. It turned out that 20-50% of lab tests were completely unnecessary, ordered by residents with no questions asked.

Classroom discussion questions:

  1. How can stopwatch studies be used in hospitals?
  2. Why is it so difficult to control costs in hospitals?

OM in the News: Measuring Health Care Quality

hospital“The goal of tying more Medicare payments to the quality—not the quantity—of health care by 2018 has intensified the debate over how ‘quality’ is defined and measured,” writes The Wall Street Journal (Jan. 31-Feb.1, 2015). Many doctors, hospitals, insurers and cost experts want to move away from the myriad quality metrics that largely measure process–toward broader measures that assess patient outcomes. This week, the National Quality Forum submitted recommendations on 199 performance measures to the U.S. Dept. of Health and Human Services. The goal is to better align measures among various programs and replace narrow process-oriented metrics with “measures that matter.”

Some doctors question whether the measures that exist can adequately measure quality. And there is little agreement on what measures matter most or are more likely to produce good value. “Measurement fatigue is a real problem in hospitals,” said a Dartmouth medical prof. “But, to me, the only metric that matters is, did you get better?”

As of last year, 33 federal programs asked providers to submit data on 1,675 quality measures. State, local and private health plans use hundreds more. Hospitals and doctors stand to lose millions in Medicare payments for missing filing deadlines or improvement benchmarks in programs that track hospital-acquired infections, readmissions and electronic-record use. The Centers for Medicare and Medicaid Services wants to move toward more quality measures “that matter most to patients and clinicians,” and note that some already had an impact on outcomes. Central-line bloodstream infections have dropped by 50% since hospitals were required to report them, and 150,000 fewer Medicare patients were readmitted to hospitals within 30 days of discharge in 2012-2013 under a federal program holding them accountable. More than 2,600 hospitals will see their Medicare payments cut 1- 3% this year—a total of $428 million— for not reducing 30-day readmissions sufficiently.

Classroom discussion questions:

1. What are the advantages and disadvantages of setting quality metrics?

2. Why do doctors oppose some of the quality measures?

OM in the News: Nurses, Ebola, and the Subject of Quality

ebolaWith Ebola leading the news every day, I am reminded of the words of Dr. Edwards Deming:  management needs to accept responsibility for quality in building systems. Deming believed an employee could not, on average, exceed the quality of a process’ capability. (His famous 14 points are summarized in Table 6.2 on page 212). Now with some nurses being blamed for the lax Ebola virus procedures in Texas, we are seeing a response from the leading nursing association.

Following news that the first U.S. nurse has now tested positive for the Ebola virus, National Nurses United (NNU, Oct.12, 2014) called for all hospitals to have in place the highest standard of optimal protections, including Hazmat suits, and hands-on training to protect all RNs, other hospital personnel to confront Ebola . NNU’s new survey of 2,000 nurses  shows:

  • 76% still say their hospital has not communicated to them any policy regarding potential admission of patients infected by Ebola
  • 85% say their hospital has not provided education on Ebola with the ability for the nurses to interact and ask questions
  • 37% say their hospital has insufficient current supplies of eye protection for daily use on their unit; 36% say there are insufficient supplies of fluid resistant/impermeable gowns in their hospital
  • 39% say their hospital does not have plans to equip isolation rooms with plastic covered mattresses and pillows and discard all linens after use; only 8% said they were aware their hospital does have such a plan in place

Not having supplies; not having equipment; not educating employees; not having a plan. All of these are systems problems, not employee problems, Deming would say.

Classroom discussion questions:

1. Who is responsible for setting quality standards and processes for Ebola treatment and prevention?

2. Which of Dr. Deming’s 14 points particularly apply in this situation?

OM in the News: Hospital Patients May Feel Better Already in New Hospital Layout

hospital3Can good hospital layout help heal the sick, asks The New York Times (Aug. 22, 2014)? The University Medical Center of Princeton realized that it had outgrown its old home and needed a new one. So management decided to design a mock patient room–similar to the process we report in our video case study in Chapter 9 (called Laying Out Arnold Palmer Hospital’s New Facility). Medical staff members and patients were surveyed. Nurses and doctors spent months moving Post-it notes around a model room set up in the old hospital. It was for just one patient, with a big foldout sofa for guests, a view outdoors, a novel drug dispensary and a bathroom positioned just so.

Equipment was installed, possible situations rehearsed. Then real patients were moved in from the surgical unit — hip and knee replacements, mostly — to compare old and new rooms. After months of testing, patients in the model room rated food and nursing care higher than patients in the old rooms did, although the meals and care were the same. But the real eye-opener was this: Patients also asked for 30% less pain medication. Ratings of patient satisfaction are in the 99th percentile, up from the 61st percentile before the move. Infection rates and the number of accidents have never been lower.

There are also some fine points to the Princeton layout, like a sink positioned in plain sight, so nurses and doctors will be sure to wash their hands, and patients can watch them do so. It’s less antiseptic, cluttered and clinical than your average patient room, more like what you find in a Marriott hotel, anodyne and low-key, with a modern sofa under a big window; soft, soothing colors; and a flat-screen TV. “The room,” writes the Times, “is dignified, which matters to a patient’s mental health. And it works.”

This is a great classroom example of the role of layout in the service sector.

Classroom discussion questions:

1. Why is layout important in hospitals?

2. What are some of the OM benefits of this new layout?

OM in the News: The Case of the Vanishing Drugs

The Aethon Tug mobile robot delivering meds at U. of Maryland hospital

“Hospitals have a drug problem.,” writes The Wall Street Journal (Feb. 24, 2014),  “and they’re looking to technology to solve it.” The problem is the way medications are being mishandled by hospital pharmacies and wards. Inventory management is inefficient, drugs are too often misplaced, and narcotic medications are prone to theft.  In addition to turning to password-protected dispensing machines, RFID tags and roaming robots to deliver prescriptions, hospitals are adopting software that tracks every dose of medication to identify suspicious activity.

By making it easier to track medicines, the changes give nurses more time to spend with patients. Mercy Hospital in St. Louis, for example, estimates that its medication-tracking system saves the hospital $600,000 a year just in time lost from pharmacists, technicians and nurses locating meds. The new systems also help improve patient safety by identifying staffers who are siphoning drugs for their own use, a problem known as “diversion.” About 15% of health-care professionals are addicted to prescription drugs at some point in their career. These drug-related inventory losses cost millions each year. The software also allow hospitals to better manage inventory by not stocking medicines that are never used, or by keeping just enough of expensive drugs on hand to meet demand.

At the University of Maryland Medical Center, mobile robots deliver medications to nursing units. Pharmacy staffers print a label, scan and place the medication in one of the robot’s locked drawers, and then enter a destination into a program that communicates wirelessly with the robot. The robot navigates its way to the right unit, where a nurse uses a passcode and fingerprint scanner to retrieve the medication. Delivery reliability—how often the drugs arrive at the unit as promised—has increased by 23%, and delivery predictability—how often they get there within the time promised—has risen by 50%. The per-trip cost with a robot averages $2.40, down from $5.50 for hand delivery, and in its first year the system freed up 6,123 hours of nurses’ time.

Classroom discussion questions:

1. Why is inventory control so important in hospitals?

2. What is the danger of “diversion”?

OM in the News: A Cure for Hospital Design

Directional guiding hospital kiosk

Endless corridors that seem to lead nowhere. Poorly marked entrances. Multiple elevator banks and incomprehensible signs. “Hospitals,” writes The Wall Street Journal (Feb. 4, 2014), ” are realizing they have a design problem as patients and visitors struggle to navigate the maze of the modern medical complex.” Confusing layouts and signage add to patients’ anxiety at a time when many are feeling ill and are coming to the hospital to undergo tests and procedures.

Now, many hospitals are borrowing strategies from shopping malls and airports to make it easier for people to get around—a process design experts call wayfinding. Technical names for departments, such as Otolaryngology, are being replaced on signs with plain language—Ear, Nose and Throat.

Confusing layouts can result from years of hospital renovations and building additions. When hospitals expand they often fail to update their signs for multiple new entrances, wings and unconnected buildings. At Rapid City Regional Hospital in South Dakota, patients from distant ranching and farming communities frequently complained about finding their way through the 650,000-square-foot complex. So medical jargon directing patients to Antepartum and Postpartum services, for instance, was changed to Labor and Delivery. The Rapid City hospital, which spent about $300,000 on its wayfinding project, installed direction-finding digital information kiosks at each of the three entrances. Different patient areas were given a different color code. If patients or visitors look lost, employees are expected to stop what they are doing and offer to help, even to escort them to their destination.

Universal symbols to help people find departments have caught on in some hospitals, especially when patients speak various languages. The symbols, such as a teddy bear to signal the pediatrics department, have reduced patient confusion at Children’s Mercy Hospital in Kansas City.

Classroom discussion questions:

1. Why are hospital layouts often confusing?

2. What can be done, besides the ideas noted in the WSJ, to improve flows?

OM in the News: Quality Problems in Hospital Internship Training

hospital qualityGiving residents less time on duty and more time to sleep was supposed to lead to fewer medical errors. But the latest research, says Time (March 26, 2013), shows  that’s not the case. Since 2011, new regulations restricting the number of continuous hours 1st-year residents spend on call cut the time that trainees spend at the hospital from 24 to 16 hours. Excessively long shifts were leading to fatigue and stress that  hampered not just the learning process, but the care these doctors provided.

But in a large new study that compared interns serving before the  2011 work-hour limit was implemented with interns working after the new rule, the number of medical  errors the post-2011 doctors reported was higher than those among previous trainees. In the year before the new duty-hour rules took effect, 19.9% of the interns reported committing an error that harmed a patient, but this percentage went up to 23.3% after the new rules went into effect.

How could fewer hours lead to more errors? For one, interns were still expected to accomplish the same amount that previous classes had, so they had less time to complete their duties. This “work compression” increases the risk of errors or mistakes if residents don’t have as much time to make and recheck patient-care decisions. And the reduction in work hours has not been accompanied, for the most part, by increase in funding to off-load the work, so current interns have about 20 fewer hours/week  to complete the same work.  Another source of errors came as one intern going off duty handed his cases to another. With fewer work hours, the number of handoffs has increased from an average of 3 during a shift to as many as 9.  Anytime a doctor passes on care of a patient to another physician, there is a chance for error in communicating complications, allergies, or other aspects of the patient’s health.

Discussion questions:

1. Relate this issue to the 10 determinants of service quality in Table 6.5 in the text.

2. What can be done from an OM perspective to improve the intern situation?