OM Podcast #48: Cold Storage, AI, and the Future of Industrial Facilities

In this episode of the Podcast, Professors Barry Render and Misty Blessley sit down with David Aschenbrand, Executive Managing Director at Newmark, to explore how cold storage and temperature‑controlled facilities are evolving in today’s operations and supply chain environment. Drawing on his background across logistics, transportation, warehousing, and industrial real estate, David explains how cold storage facilities support food, pharmaceutical, and other temperature‑sensitive supply chains, and what clients look for when developing or operating these specialized buildings.

The conversation highlights how facility design decisions—such as location, building footprint, dock configuration, and proximity to ports—can directly affect labor availability, transportation efficiency, and long‑term operational performance. David shares insights on the growing role of automation and AI in industrial facilities, while emphasizing the continued importance of skilled trades and hands‑on roles that support these operations.
The episode concludes with a discussion of what rising labor costs mean for cold storage operators. Together, the hosts and guest offer a practical look at how operations management, facility design, workforce trends, and technology intersect in modern cold chain and warehouse environments.


TRANSCRIPT LINK
A Word document of this podcast will download by clicking the word Transcript above.

Prof. Barry Render
Prof. Misty Blessley
Dave Aschenbrand

Have you subscribed to this podcast on Apple Podcasts?
Just open your Apple Podcasts app, search “Heizer Render Munson OM Podcast,” and subscribe to get our newest episodes as soon as they’re released!


Instructors: assignable auto‑graded exercises using this podcast are available in MyLab OM. To learn more, view our earlier blog post featuring Chuck Munson or contact your Pearson representative: Find your rep

Guest Post: The Two Stories of Tesla’s Solar Panels

Temple U. Professor Misty Blessley provides interesting blog topics monthly.

In our 2023 OM blog, New York State Built Elon Musk a $1 Billion Factory, we learned that building a solar panel facility was “a bad deal” for NY. The state built a massive plant and provided solar-panel manufacturing equipment. Tesla’s end of the deal was to churn out enough solar-panel shingles by 2020 to cover 1,000 roofs on a weekly basis.

These solar panels are finally on the verge of materializing, and with this are two stories. One connects Tesla’s long game in vertical integration and the other is New York’s long-delayed economic vision.

Tesla’s Long Game in Vertical Integration
Tesla’s new residential solar panels fill the company’s missing piece. The firm was missing the energy generator (aka solar panel). Despite the solar factory in New York, Tesla spent years relying on third-party suppliers for its solar panels. Now, it can fully optimize performance across the entire home energy stack. Tesla can vertically integrate the full chain from generation (solar panels), to conversion (inverter), to storage (Powerwall), and to consumption (EV charging).

New York’s Long-Delayed Economic Vision
This pivot finally gives New York its payout. By bringing solar panel manufacturing in-house, Tesla is delivering the kind of industry and employment the state originally hoped for. The region, once defined by its industrial decline, gains a foothold in the clean energy manufacturing economy. The move aligns with federal and state incentives that reward U.S.-made components, strengthening the economic logic behind NY’s investment. Tesla’s shift toward a unified home energy ecosystem mirrors the vision that justified the state’s $1 billion bet. The factory, once criticized as a stranded asset, now becomes the manufacturing backbone of Tesla’s residential energy strategy.

Tesla didn’t just release new solar panels. It connected the car in the driveway to the sun, and in doing so may have finally delivered the manufacturing story NY was waiting for.

Classroom Discussion Questions:
1. How is vertical integration good for Tesla? For Tesla owners? To compare this to an internal combustion engine, it is somewhat like having petroleum, a refinery and a gas pump in the garage or driveway.

2.  Knowing that Tesla’s occupation of the Buffalo facility is long overdue, what stipulations should a city or state impose on a firm when incentivizing a location decision to the tune of $1 billion?

OM in the News: Amazon Goes Rural

In dozens of thinly populated regions across the country, Amazon is building new delivery hubs to deliver packages in around 2 days. That might not seem especially rapid at a time when the e-commerce giant is introducing one-hour delivery in some areas, but residents of some far-flung Montana hamlets were used to waiting up to a week for their orders. It is part of a $4 billion investment by Amazon to push its signature speedy delivery further into the rural recesses of the U.S., writes The Wall Street Journal (March 22, 2026)

An Amazon driver taking a photo after dropping off a package in Connor Montana

The effort helps Amazon reduce its reliance on the U.S. Postal Service, a relationship that has become rocky following a dispute over contract terms. Amazon says it aims ultimately to have 200 rural delivery hubs serving around 13,000 ZIP Codes covering around 1.2 million square miles of America—an area the size of Texas, California and Alaska combined.

Delivering packages within Amazon’s signature 2-day frame means drivers contend with backcountry challenges such as bighorn sheep on the road, dangerously high winds in mountain passes and roads that are impassable during parts of the year.

Over the past decade, Amazon has expanded from major cities to regional urban centers by drawing ever larger circles of coverage. That is now allowing the company to lean on those urban hubs to speed up deliveries in ranch country. There are signs that Amazon customers in remote areas are just as likely to get hooked on speedy delivery as city slickers.

Amazon is experimenting with speedier delivery across its network as it competes with longtime rival Walmart and delivery upstarts such as Uber and DoorDash. In urban areas, the company has started offering 1-hour and 3-hour delivery as premium options. Amazon recently acquired a Swiss startup called Rivr, which is building 4-legged robots that could drop packages off on doorsteps. The e-commerce giant is also dipping its toe in the big-box retail business, with plans for a 230,000-square-foot megastore outside Chicago.

Classroom discussion questions:

  1. What are the complications in trying to serve remote locations with 2-day delivery?
  2. Why does the firm think the extra expenses will pay off?

Guest Post: Martin Guitars and Operations

Prof. Howard Weiss, retired from Temple U., illustrates his wide range of interests.

Martin is a guitar manufacturer that began operations in 1833. Martin specializes in acoustic guitars which account for about half as many guitars as electric guitars in the global guitar market. It is one of the most popular brands along with Fender, Gibson, Yamaha, Ibanez and Taylor.  

Location: Martin began its operation in Manhattan. In 1839 Martin opened a plant in Nazareth PA, 90 miles due west of its NYC plant. In 1989 Martin opened a plant in Sonora, Mexico in order to make guitars that were more affordable. It is worth noting that two of Martin’s competitors, Fender and Taylor guitars also have plants in Mexico. These guitars are commonly referred to as MIM (Made in Mexico). See Ch.8.

Capacity: Martin has made over 3 million guitars since its inception, including one million since 2016. It currently produces a total of 500 guitars per day, 6 days per week, at the two plants. (See Supp. 7)

Forecasting: Clearly demand has been increasing. Martin’s forecasting needs to consider historical and causal analysis (see Ch. 4) since certain events can spike or drop the sales. For example, sales increased more than usual during the folk music craze and also when MTV was running its Unplugged series (featuring acoustic guitars). At first, COVID caused a decline in sales due to cancelled concerts and closed stores. But then there was an increase in demand, especially for beginner guitars since people were looking for activities while at home and could order guitars online.

Supply Chain: The supply chain (Ch. 11) begins in the forest and at the lumber facilities both in the U.S. and India.

Layout: Martin uses process layout–see Ch.7. Most of the work is done by hand but there are robots in the factory.

Safety: With all of the woodwork that is being performed the major safety concern is that of sawdust.

Quality Control: The incoming wood is inspected by humans because machines cannot pick up defects in the wood. Each guitar is checked for tone. The guitar gets put in a case, but then sits for 4 days and then undergoes rigorous testing to make certain the guitar parts, e.g. neck, bridge, tuning pegs, still work. (See Ch. 6).

Classroom Discussion Questions

  1. How could Martin use the Quality Control techniques discussed in Ch. 6 of your text book?
  2. What are some possible reasons Martin relocated from Manhattan to Nazareth, PA?

Guest Post: FedEx Network 2.0– The Real-World Challenges of Facility Closures and Location Strategy

Dr. Jon Jackson is Associate Professor of Operations Management  and the MSBA Director in the School of Business at Providence College.

In 2022, FedEx announced its “Network 2.0” initiative, designed to streamline and integrate the resources of its Express, Ground, and Freight operations. This project was initially estimated to cost $2 billion, would result in the closure of 100 stations, and was targeted for completion by fiscal year 2027.

As of this month, February, 2026, FedEx has closed more than 200 stations, with projections indicating a total of 475 closures by the end of 2027 as part of the Network 2.0 initiative. This accounts for nearly 30% of the company’s facility footprint across the United States and Canada, writes Supply Chain Dive (Feb. 13, 2026). 

As discussed in Ch. 8 (Location Strategies) in your Heizer/Render/Munson textbook, location strategy involves not only selecting new sites but also making tough calls about which existing facilities to consolidate or close. For FedEx, network streamlining was prompted by significant overlap between Express and Ground operations. Scott Ray, the COO-elect for U.S. and Canada surface operations explained, “The concept is pretty straightforward: Our customers don’t need both an Express and a Ground truck in the same neighborhood on the same day, and they don’t need to separate their Express and Ground packages for two separate pickups.”

One of the main challenges for FedEx during this transformation is maintaining high service levels amid such a significant network overhaul. The company has addressed this challenge by creating dedicated routes for high-priority services and customers, as well as factoring in market-level characteristics.

(A regularly updated list of FedEx station closures is available on Supply Chain Dive)


Classroom Discussion Questions

  1. FedEx has already closed twice as many stations as originally projected in 2022. What factors could have led to this outcome? Do you see this as a cause for concern, or could it indicate greater-than-expected benefits?
  2. In your local metro area, what factors should FedEx consider when deciding which stations might be closed, if any?

OM in the News: AI Push Is Costing a Lot More Than the Moon Landing

It’s bigger than the railroad expansion of the 1850s, the Apollo space program that put astronauts on the moon in the 1960s and the decadeslong build-out of the U.S. interstate highway system that ended in the 1970s.

We’re talking about the data centers now being built and financed by some of the world’s biggest companies in the artificial-intelligence boom. Four U.S. tech giants—Microsoft, Meta, Amazon, and  Google—are planning to spend $670 billion to build out AI infrastructure this year alone as they scramble to increase the computing power needed to operate and scale their AI-related endeavors.

And if you compare this spending to some of the biggest capital efforts in U.S. history by percentage of gross domestic product, you can see exactly how staggering the figures are, reports The Wall Street Journal (Feb. 9, 2026). In fact, it’s dwarfed only by the Louisiana Purchase, completed in 1803, which doubled the size of the U.S. and consumed 3% of the GDP.  (The AI buildout is projected at 2.1% of GDP, while railroads in the 1850s were 2%, the US highway system was 0.4%, and the Apollo space program was 0.2%).

The four companies’ capital spending has been increasing as a percentage of their annual revenue the past few years. In 2026, Meta’s spending could amount to more than 50% of its sales for the first time ever.

How is this build-out an OM issue? First, as we discuss in Chapter 2, these four companies are betting that they will attain competitive advantage by competing on low-cost and response. Second, our chapter on sustainability (Supp. 5) points out the costs of carbon footprints, which data centers generate heavily. Third, as we note in the chapter on location strategies (Ch. 8), the centers locate where power is cheap and plentiful.

As of late 2025, Northern Virginia has 64 data centers under construction, solidifying its position as the world’s largest data center market. The region hosts over 550 existing facilities.  They consume massive amounts of power, comparable to the total usage of large states like Minnesota.

Classroom discussion issues:

  1. Discuss the plusses and minuses of this massive construction trend.
  2. What do the builders hope to obtain?

Guest Post: Optimal Location vs. Center of Gravity


Retired Temple U. Prof. Howard Weiss created the Excel OM and POM software that we provide free with our text.

Chapter 8 of your Heizer/Render/Munson text introduces the Center-of- Gravity (COG)
method which has a goal of finding a location that minimizes the total cost or weighted distance of shipping to multiple locations. The textbook notes that the COG may not optimize the total cost but that the method to optimize the cost is more complex than simply finding the weighted average coordinates. In this blog I show how to let Excel’s Solver do the complex work to find the coordinates that actually minimize the total weighted distance.

Consider the Quain’s Discount Department Stores example. The spreadsheet below displays the Excel model for this example. Column F contains the weighted distance from the center of gravity. For example, cell F5 contains:
B5*SQRT((C5-C$12)^2+(D5-D$12)^2)

Cell F9 contains the weighted total from the COG while cell G9 contains the weighted distance from Solver’s changing variable cells in row 14. The figure shows the optimal solution in row 14 but the starting values in row 14 can be set to any two numbers. Solver’s objective is to minimize the sum of the weighted distances shown in cell G9. There are no constraints.

For this particular example, we know that the coordinates will be non-negative so we leave the “Make Unconstrained” checkbox at its default checked position. The method is set to GRG Nonlinear.

Solver yields optimal coordinates of x = 63.86 and y = 97.27, with a minimum total weighted distance of 299,234. The COG in your text of x=66.67, y = 93.33 is very close to the optimal coordinates and leads to an extra cost (cells G10 and G11) that is less than 1% above the optimal cost. This agrees with the textbook’s note that the extra cost using the COG is less than 2% above the optimal cost.

Guest Post: Location Analysis and Community Attitudes

Prof. Howard Weiss, developer of the Excel OM and POM software that we provide free with our text, explains NIMBY.

In considering location strategy, as discussed in the Location chapter (Ch. 8) of Heizer/ Render/ Munson, it is critical to recognize that site selection is influenced not only by operational and cost factors but also by the social and political climate of the host community. One powerful expression of community resistance is encapsulated in the acronym NIMBY—“Not In My Back Yard.” The 1970’s term describes a paradoxical stance: residents often acknowledge the necessity of a facility or infrastructure project but strongly oppose its placement within their immediate vicinity.

A recent example can be found in Middletown, PA, where residents protested the conversion of a decommissioned coin mint into a warehouse. While the project promised potential economic benefits, community members expressed concerns over increased traffic congestion, heightened noise levels, possible pollution, and the erosion of local character. Such reactions are emblematic of broader NIMBY dynamics, where objections are rooted in both tangible and intangible perceived costs.

In addition to the Middleton commonly cited reasons for opposition, others include include health risks, pollution, crime, diminished aesthetic beauty, property values, security, parking, scenic views, access to natural resources, and environmental concerns (such as  habitat disruption and air and water contamination).

NIMBY disputes span a wide range of industries and public projects. In the U.S., notable examples include the halted completion of the Shoreham Nuclear Power Plant on Long Island; resistance to homeless shelters/housing in San Francisco; opposition to offshore wind farms near Cape Cod; battles over California’s high-speed rail; community pushback against cell tower installations in suburban neighborhoods; and municipal bans on hydraulic fracturing in cities such as Denton, Texas. Other contentious proposals have involved the expansion of hazardous waste landfills (East Liverpool, Ohio), medical marijuana dispensaries, and psychiatric treatment centers.

NIMBY is not confined to the U.S. In the U.K., plans to build a prison near the town of Thornton faced intense local opposition. In Australia, residents of Eastern Creek fought against the development of a waste-to-energy incinerator.

For operations managers, the implication is clear: location strategy cannot be determined by quantitative factors alone. Understanding and addressing community attitudes is essential to minimizing conflict, avoiding costly delays, and ensuring long-term project viability.

Classroom discussion questions:

  1. Why is this an OM issue?
  2. Have any students faced a NIMBY development in their communities? The results?

OM in the News: Technology Supply Chains and the Shift From China

Rising costs, geopolitical tensions, and trade disruptions are causing tech giants like Apple, Samsung, Dell, and Nokia  to find suppliers at new locations across Asia, reports Material Handling & Logistics (June 19, 2025).

India, Malaysia, Thailand, Vietnam, and Taiwan have emerged as the most prominent alternative suppliers to China for the technology industry, despite Taiwan’s own geopolitical challenges.

The products most affected by these diversification strategies include smartphones, smart watches, computers, and laptops, representing core product lines for the world’s leading technology manufacturers.

Despite the rhetoric in support of nearshoring that was born out of the pandemic, U.S. companies like Apple have kept the largest share of their suppliers in Asia. This is because of the comparative advantage that exists in countries like India, Malaysia, Thailand, Vietnam, and Taiwan.

Here are the regional advantages of each:

India: Offers a large domestic workforce skilled in smartphone and laptop manufacturing at a fraction of the labor cost. The country has rapidly developed its technology manufacturing capabilities, particularly in smartphone assembly, where it has become a major production hub for both Samsung and Apple devices. India’s combination of technical expertise, lower wages, and massive domestic market makes it particularly attractive for technology companies.

Malaysia: Has well-established infrastructure and a low-cost workforce skilled in the back-end processes of semiconductor manufacturing. Malaysia has developed specialized expertise in semiconductor packaging and testing, making it a critical node in the global chip supply chain. The country’s established technology parks and government support for high-tech manufacturing have created a conducive environment for technology suppliers.

Vietnam & Thailand: Government incentives, including tax breaks for technology companies and funding for new facilities, have fostered an innovative environment for new suppliers. Vietnam has emerged as a particularly important alternative for smartphone and laptop manufacturing, while  Thailand has developed strengths in smartwatch and computer production. Both countries have benefited from their proximity to China’s supply ecosystem while offering lower costs and reduced geopolitical risk.

Taiwan: Taiwan is becoming increasingly prominent in the global computer parts supply chain. Taiwan’s world-leading semiconductor industry, centered around TSMC, gives it a unique and difficult-to-replicate advantage in high-end electronics manufacturing. The country’s technical expertise and established ecosystem for advanced electronics production make it an essential partner for many technology companies.

Classroom discussion questions:

  1. Does this article conflict with the the fact that reshoring continues to add jobs in the U.S.?
  2. What do these 5 countries have in common?

Guest Post: The Importance of Shelter Location in Disaster Management

Amir Hossein Moadab is receiving his PhD at Washington State U., under the tutelage of Dr. Chuck Munson.

In late September 2024, Hurricane Helene devastated parts of the southeastern U.S., with Florida and the Carolinas suffering the greatest impact. The storm resulted in over 250 fatalities and displaced tens of thousands. Alongside other disasters such as the increasingly frequent California wildfires, this event highlights a critical question: if we can’t prevent disasters, how can we reduce their impact? One of the most important parts of disaster preparedness and response is figuring out where to locate emergency shelters, a decision that can significantly influence survival rates, response speed, and fair access to resources for everyone affected.

Shelter location isn’t just about choosing a convenient spot on a map; it’s a complex decision that involves balancing accessibility, capacity, existing infrastructure, and the needs of the community. In a real emergency, roads might be blocked, public transportation may shut down, and people with disabilities or no access to private vehicles face even bigger challenges. Overcrowded or under-equipped shelters slow things down and make it harder to meet people’s basic needs, especially for vulnerable populations.

To make shelters more effective, planners increasingly turn to social vulnerability indices (SVIs), which use demographic and socioeconomic data (like age, income, disability status, and housing conditions) to identify communities most at risk. Placing shelters closer to these communities helps ensure people can get to safety quickly. Turning that insight into action means using various planning tools and optimization models to figure out the best shelter locations.

The main methods used include: (1) models which aim to reach the largest number of people within a certain response time, (2) models which help reduce the average or maximum distance people must travel to reach a shelter, (3) models that prepare for unpredictable disruptions like blocked roads or power outages, and (4) optimization models that balance that cost, equity, and accessibility.

In the U.S., FEMA plays a leading role in this process. FEMA uses geographic tools like GIS, hazard maps, and community risk profiles to help states and cities decide where shelters should go, aiming to make them reachable, practical, and equitable. Shelter planning isn’t just a technical task, it’s ultimately about people. Done right, shelter planning saves lives, eases suffering, and builds trust. 

Classroom Discussion Questions:

  1. What are the most important key success factors in determining shelter locations during a disaster?
  2. How do disruptions affect shelter planning decisions, and how can models account for these uncertainties?

OM in the News: Locating an AI Data Center Means Huge Power Needs

Meta Platforms just scooped up 2,700 acres of Louisiana farmland for what would be its largest-ever data center, built over flat rice fields in one of the poorest corners of the state.  At 4 million square feet, or 70 football fields, Meta’s data center will cost $10 billion and sit on more acreage than L.S.U. in Baton Rouge, which has more than 34,000 students. CEO Zuckerberg says the site will be used to train future versions of Meta’s open source AI models and be “so large it would cover a significant part of Manhattan.”

Building advanced artificial-intelligence systems will take city-sized amounts of power, which has turbocharged electricity demand projections for the first time this century, reports The Wall Street Journal (March 31, 2025). 

operations management and artificial intelligence and AI and location
Construction at the site of Meta’s new data center in Holly Ridge, La

Tech companies are pressing into unexpected parts of the country, far from traditional data-center markets such as Northern Virginia. They are hunting for huge swaths of flat land with access to natural gas and transmission lines, landing them on the doorstep of oil-and-gas country. To meet the voracious power needs of the project and other growth, Entergy Power intends to spend $3.2 billion to build three natural gas-fired power plants, tapping the state’s vast gas reserves.

In tiny Holly Ridge, La., hundreds of pieces of construction equipment are rolling past, with 5,000 construction workers on the way. Meta will bring money, jobs and local tax revenue. But the project also threatens to burden electricity customers across much of Louisiana with higher costs if demand from the tech giant eventually dries up.

L.S.U. estimates Meta could use 15% of Louisiana’s current electricity generation. That is worrisome to other utility customers largely because of the mismatch between the 40- 50 year lifespan of gas-fired power plants and Entergy’s 15-year deal with Meta.

Meta’s permanent jobs—around 500—are fewer than the thousands that might have accompanied an auto factory. For a region with a median household income of $53,000, the impact will be meaningful, though. Average salaries at Meta are projected at $82,000.

As we discuss in Chapter 8, Location Strategies, states often must offer financial incentives to draw major new employers. To woo Meta, Louisiana approved a sales-tax exemption for data-center equipment and helped procure more land from local farmers.

Classroom discussion questions:

  1. Are the incentives offered Meta unusual or risky?
  2. Why are data centers and their current technologies controversial?

OM in the News: Corruption’s Impact on Operations

Transparency International, which compiles the annual Corruption Perceptions Index (which we publish as Figure 8.2), found that 47 countries out of the 180 it surveyed had their lowest score last year since it started using its current methodology for its global ranking. (See transparency.org/en/news/, Feb. 11. 2025).It said of its 2024 survey that “global corruption levels remain alarmingly high, with efforts to reduce them faltering.”

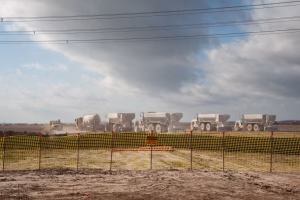
The group also pointed to worldwide risks from corruption to efforts to combat climate change. It said that a lack of transparency and accountability mechanisms increases the risk of climate funds being embezzled or misused, while “undue influence,” often from the private sector, obstructs the approval of ambitious policies. The organization measures the perception of public sector corruption according to 13 data sources, including the World Bank, the World Economic Forum and private risk and consulting companies. It ranks 180 countries and territories on a scale from a “highly corrupt” 0 to a “very clean” 100.

The global average remained unchanged from 2023 at 43, with more than two-thirds of countries scoring under 50. Denmark held on to first place with 90 points, followed by Finland with 88 and Singapore with 84. New Zealand dropped from third to fourth. The U.S. slid from 69 points to 65 and from 24th place to 28th

South Sudan slid to the bottom of the index with just 8 points, displacing Somalia although the latter country’s score dropped to 9. They were followed by Venezuela with 10 and Syria with 12. In the Middle East and North Africa, the situation of anti-corruption efforts “remains bleak” as political leaders exert near-absolute control while benefiting from wealth and clamping down on dissent. But it said that “unforeseen opportunities are also emerging,” for example in the wake of the fall of President Assad’s government in Syria. Sub-Saharan Africa had the lowest average score of any region, at 33.

In Asia and the Pacific, governments “are still failing to deliver on anti-corruption pledges,” Transparency International said.

Classroom discussion questions:

  1. Why is this annual index useful in OM?
  2. Explore the variables used in creating the ranking.

OM Podcast #29: The Art & Science of Developing Supply Chain Strategies

Happy New Year!  After a brief end of semester break to enjoy the holidays with family, we’re back with the first podcast of 2025.  In this podcast, Barry Render interviews Alex Klein, Senior Manager of Supply Chain Solutions for APL Logistics, a third-party logistics provider.  Alex and Barry discuss the art and science of developing supply chain strategies for shippers with three fascinating, wide-ranging real world examples from Alex’s career.

Transcript

A Word document of this podcast will download by clicking the word Transcript above.


Have you subscribed to this podcast on Apple podcasts? Just go to your Apple podcasts app, search “Heizer Render OM Podcast,” and subscribe to get all our podcasts on your mobile device as soon as they come out!

Instructors, assignable auto-graded exercises using this podcast are available in MyLab OM. See our earlier blog post with a recording of author and user Chuck Munson to learn how to find these, or contact your Pearson rep to learn more! https://www.pearson.com/en-us/help-and-support/contact-us/find-a-rep.html

Guest Post: Vertical Farming

Prof. Howard Weiss, who developed the Excel OM and POM software that accompanies our text for free, shares an interesting thought.

One of the location factors displayed in Figure 8.1 of your Heizer/Render/Munson textbook is the size of the potential location. One way to increase the size available for operations is to build vertically. This is why there are skyscrapers in so many cities. As the populations in cities grew there was a need for more room for both housing and business and skyscrapers create more room on the same building footprint.

The concept of expanding operations vertically has now reached the farming industry. Vertical farming is a technique where crops are grown on top of each other, typically indoors inside a facility that may be a skyscraper, warehouse or shipping container.

There are several advantages to vertical farming. First, of course, is that more crops can be raised on a smaller facility footprint. These farms operate in a highly controlled environment. Weather has minimal or no effect on these farms because the temperature, humidity, light and water are completely controlled. Also, different crops can be developed simultaneously whereas on a traditional farm different crops are planted and harvested in succession. Because the farms are indoors there is year- round crop production. Water can be recycled and reused. The farms can be located closer to urban centers reducing transportation costs. Less labor is required.

However, there are several downsides to vertical farming. While fewer employees are required than on a typical farm, these employees need to learn new skills. The startup costs for a vertical farm are higher than the startup costs for a traditional farm. While the environment is controlled, the energy costs to do so are higher than energy costs on a typical farm. In addition, energy costs have been rising both in the U.S. (8.4% higher) and Great Britain (58% higher) over the past few years and the carbon footprint of a vertical farm is larger than that of a typical farm. The cost to the consumer of the food that is grown is higher than food from typical farms. The types of crops that can be grown is not as large as that of a typical farm.

Classroom Discussion Questions
1. How could an individual take advantage of vertical farming when growing vegetables?
2. Are there any vertical farms located near your university location?


OM in the News: Orlando’s Theme Park Cluster

When organizations make location decisions (see Chapter 8), being near competitors (“clustering”) is often seen as a plus. Here in Orlando, the capital of theme parks, we take our cluster very seriously. After all, the parks are the main economic drivers and top employers. Disney’s 5 parks employ some 77,000 “cast members.” Universal Studios parks another 28,000, and SeaWorld has 22,100. Then there is Legoland, Gator Land, and others.

Riders on the Expedition Everest roller coaster at Walt Disney World’s Animal Kingdom park.

When the Universal Epic Universe theme park opens next year, it will add 750 acres populated by Harry Potter, Donkey Kong and dragons to the company’s Central Florida resort, which now includes 3 theme parks: Universal Studios, Islands of Adventure, and Volcano Bay Water Park.

Less than 10 miles down the road is Walt Disney World, the biggest part of Disney’s most important profit engine, and the stuff of dreams for tens of millions of visitors a year. Its 5 parks include: Magic Kingdom, Animal Kingdom, Epcot, Hollywood Studios, and Typhoon Lagoon Water Park.

The competition is intense, writes The Wall Street Journal (April 13-14, 2024). To understand the stakes for both companies, consider this: A common vacation itinerary includes 3-4 days at Disney World and 1-2 days at Universal. If Universal can now persuade families to spend one more day at its parks instead of at Disney, it could nab hundreds of millions of dollars in annual revenue. A family of four visiting Disney World for a 5-day, 4-night stay with Park Hopper tickets, a quick-service dining plan and a room in a moderate-tier hotel would spend upward of $5,000, not counting the cost of souvenirs or add-ons such as the Genie+ line-skipping service. Shortening the Disney leg by even a day would trim hundreds of dollars from their spending at the company’s parks and resorts.

When Walt Disney World opened in 1971, about 5 years after the death of the company’s namesake founder, adult admission cost $3.50. Visitors could roam Magic Kingdom—the only theme park on the property at the time—and take in dozens of free attractions and performances.

Attendance has since snowballed. Universal’s first theme park first opened in 1990. Islands of Adventure now attracts more than 11 million visitors a year, while Universal Studios has about 10.8 million guests. Disney’s Magic Kingdom, which has more than 17 million annual visitors, has long been the world’s most-visited theme park.

Classroom discussion questions:

  1. Why is clustering important in theme parks?
  2. Describe a different cluster, one close to your college or home.