
Drones, in the headlines every day from Russia, Iran and Hezbollah, are also real manufacturing tools that can add valuable context and support. “They provide clear value in activities that are traditionally labor-intensive, disruptive or difficult to perform safely,” writes Industry Week (May 7, 2026).
Drones are making inroads in manufacturing in these two areas:
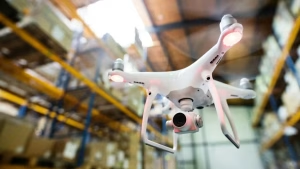
Inventory tracking: Indoor drones equipped with barcode scanners and computer vision systems can perform inventory scans with minimal disruption. In large warehouses or storage areas, they can significantly reduce cycle-count time and increase count frequency. The real-time data can be integrated into corporate software platforms, reducing excess stock and decreasing production delays due to stockouts.
Inspection: Conventional industrial inspections often require scaffolding, rope access, shutdowns or travel. They expose workers to heights, to confined spaces or to environmental hazards. Drones can transform this activity. High-resolution visual, thermal, ultrasonic and lidar payloads allow inspection of hard-to-reach areas, including storage tanks and silos, pipe racks, roof structures and overhead utilities. For remote manufacturing facilities, a drone mission can eliminate days of logistics and increase safety performance.
 The business impact is measurable: reduced downtime, lower mobilization costs, reduced safety risk and faster response to problem detection. In the energy and utilities sector, drone-based inspection has been estimated to reduce inspection costs by 70% and downtime by 90%.
Future innovation: The next stage in drone deployment is autonomous operation. Drones will increasingly operate from fixed docking stations, launching automatically to perform scheduled inspection missions. Data collected during these flights can be transmitted to AI-enabled analytics platforms and integrated into operational systems in near real-time. Coordinated drone swarms may be used to conduct large-scale inspections and surveys across a large infrastructure.
Challenges: Concerns about workforce displacement are common, and the increased adoption of drones is no exception. But drone programs typically augment skilled labor rather than replace it. Technicians can become certified drone pilots, remote inspection specialists, data analysts or AI-assisted defect reviewers.
Modern industrial drones are connected devices and must be treated as operational technology nodes within the broader cybersecurity architecture. A compromised drone platform presents a risk that goes beyond simple device failure. It may expose critical infrastructure data or provide a means to compromise enterprise networks.
Still, a fully scaled drone program that makes good use of its data is a significant strategic asset.
Classroom discussion questions:
- What other industries are already commonly using drones?
- Discuss their use in modern warfare.
 Microsoft (by 7%), Block (parent of Square and Cash App by 40%) and Meta (by 8,000) are just the latest major tech companies trying to scale back their workforces in the name of AI. Layoffs affecting 45,800 tech employees were just announced, making March 2026 the worst month for reported tech-job reductions in at least 2 years.
 Walk into almost any operations and supply chain meeting today and you’ll hear it:
 Telephone Switchboard Operator. Before direct-dial telephone systems took over, switchboard operators were the backbone of communication, ensuring calls reached the right destination. In the 1950s, the U.S. had about 1,342,000 telephone switchboard operators. It was a demanding job that required quick reflexes. By the 1970s, automated dialing systems phased out the need for human operators.
 Milkman. Having fresh milk delivered to your doorstep was once a common part of American life. The local milkman made rounds, leaving glass bottles on doorsteps and retrieving empty ones. This service was necessary before the widespread adoption of home refrigeration. By 2005, this number had dwindled from over 50% of homes receiving delivery to just 0.4%.
 Motion Picture Projectionist. Projectionists played a vital role in the moviegoing experience in the 1950s, operating and maintaining film projectors in theaters. By 2013, 92% of movie theaters had made the switch to digital projection. In 1950, 26,000 people were employed as projectionists. By 2023, that number had fallen to 2,610.
 Prof. Howard Weiss, retired from Temple U., illustrates his wide range of interests.
 For two decades, manufacturing has been defined by a relentless pursuit of optimization. We automated assembly lines (Ch. 9), digitized records and built predictive maintenance models (Ch. 17), all in the service of marginal gains in efficiency.
 During the Digital Revolution of the last quarter-century, U.S. GDP rose by 66%. Data show the extraordinary capacity of the American economy to absorb new technology. Since 2000 on average 5 million Americans have either been laid off or quit their job every month, but the economy has created 5.1 million better-paying jobs a month. This creative destruction isn’t new. In 1810, 81% of Americans worked in agriculture; today only 1.2% do. In 1953, 32% of Americans worked in factories. As real industrial production quadrupled, the share of the labor force in manufacturing declined to 7.8% in 2025.
 Perhaps the most immediate and profound impact of generative AI in industry is its function as a “generative user interface” or “Gen UI.” For decades, interacting with complex industrial software and data systems required specialized training. Engineers needed to learn specific query languages to pull data; operators had to navigate complex, menu-driven screens on a human-machine interface; maintenance staff had to know exactly where to find a specific manual in a labyrinthine document management system. The Gen UI changes everything. It provides a conversational, natural language layer that sits between the human user and complex backend systems. It radically lowers the barrier to entry for accessing critical information.
 Workers complained of speed-up, work intensification, and work degradation. Now this appears to be happening with A.I. in one of the fields where it has been most widely adopted: coding.
 Temple U. Professor Misty Blessley raises an interesting inventory issue–returns.
 That all changed with the “shale gale” of the early 2000s, writes Industry Week (Jan. 9, 2025)
 And despite the environmental backlash to nuclear energy over the past 40 years, the U.S. still generates the most nuclear power worldwide, producing 780,000 gigawatt hours (GWh) annually, compared to runner-up China with 400,000 GWh.
 Jeff Schulze, at ClearBridge Investments, argues this productivity jump is thanks to some unique features of the postpandemic labor market. People have switched jobs, locations and even industries at a high rate, meaning workers are now better matched to their roles. “When you look on the horizon with all this investment in AI, it’s not hard to get too excited about a productivity boom that will move us up to 2.5% or even 3%,” he states.
 Prof. Andrew Stapleton teaches OM at U. Wisconsin-LaCrosse