OM in the News: Starbucks Uses New Technology to Fill Orders Faster

 Starbucks says new technology is helping fix one of its customers’ biggest gripes: waiting too long for their coffee. A technology pilot at dozens of U.S. locations has shaved 2 minutes off the average time to make a beverage ordered inside cafes. Starbucks said 3/4 of orders at the test cafes’ busiest times were completed in 4 minutes or less, nearing its service-time goal, while not delaying mobile orders.

The company plans to soon expand the pilot to hundreds more of Starbucks’s 10,000 U.S. locations as it tries to recapture lost sales and improve customer sentiment. Starbucks is looking to jolt its business after reporting four consecutive quarterly declines in same-store sales. Customers have balked at the chain’s prices and lines, turning to rivals for cheaper and faster coffee, reports The Wall Street Journal (April 30, 2025).

Starbucks’ CEO has said it needs to improve its speed of service, particularly during the morning rush. Earlier this year, about half of in-store orders took longer than 4 minutes. Mobile orders averaged around 6 minutes to complete. Baristas currently handle orders on a first-come, first-served basis. The new algorithm will determine sequencing across cafe counters, drive-throughs and apps.

Starbucks also brought on six engineers who had worked for a software startup that helped restaurants better manage delivery orders. The team helped build the new proprietary order-scheduling algorithm in-house.

Starbucks is also using the new technology to experiment with scheduling specific pickup times for mobile orders. Baristas are learning to time the making of mobile orders based on factors such as order complexity, aiming to prevent drinks sitting out for minutes before a customer arrives. The new order-sequencing algorithm is “rules based,” following a predetermined “if-then” structure, rather than being powered by AI.

The company is harnessing technology in other areas, including improving its staffing levels. Currently it also has a 700-store pilot aimed at putting the right number of workers in cafes based on demand.

Classroom discussion questions:

  1. What process improvement tools in Chapter 7 could Starbucks use to improve ?
  2. From your own experience, what OM suggestions would you give the firm?

OM in the News: How Chick-fil-A Uses OM to Make Fast Food Faster

Atlanta-based Chick-fil-A is on the vanguard of fast-food drive-through operations management, regularly dispatching specialist teams to its more than 3,000 restaurants to study the minutiae of parking-lot traffic patterns and how employees hand off orders. Chick-fil-A recently notched $21.6 billion in U.S. sales, the highest per-restaurant total in the industry (even though the chain stays closed on Sundays). About 60% of its sales happen at drive-up windows.

Burgeoning demand has threatened the “fast” in Chick-fil-A’s fast-food model, writes The Wall Street Journal (Feb. 2, 2025). The “cockpit”—the hectic corner of the kitchen where orders are bagged and handed off to drivers—was growing crowded. Drive-through lanes would run out of room for cars, which sometimes spilled beyond the parking lots. Customer studies regularly gave the chain top marks for quality, accuracy and service, but its drive-throughs ranked highest in time elapsed from entry to exit.

At the new store near Atlanta, Chick-fil-A has 4 drive-through lanes and an elevated kitchen.

For years, Chick-fil-A’s popularity has resulted in long lines of cars. For example, one Chick-fil-A in Rockford, Illinois was straining under a crush of customers lured by a chicken sandwich deal one recent Friday afternoon. Cars inched along 2 drive-through lanes while workers tapped in orders and others handed off bags of sandwiches and fries. Later, the store operator and OM process analysts from the chain’s headquarters hunched over a laptop studying the earlier mayhem. Security cameras in the kitchen and a drone hovering over the parking lot had captured footage of the rush, which set a new sales record for the store. At its peak, the drive-through served one car every 13 seconds, an enviable achievement for any fast-food operation. But not good enough for the company.

OM  insights are reshaping Chick-fil-A’s restaurants. One recently opened near Atlanta with no dining room but 4 drive-throughs that can serve some 700 cars an hour. A second-floor kitchen prepares food that is delivered to the cars below via a system akin to a dumbwaiter.

Restaurant operators have also explored different ways to take drive-through orders. Instead of relying on speaker boxes, they stationed workers outside to take orders directly from idling cars, then call them into the kitchen through cellphones or headsets. That practice helped speed up service, and that customers appreciated more direct interaction.

Classroom discussion questions:

  1. What process analysis tools in Chapter 7 of your Heizer/Render/Munson text could be used to improve quality and service times?
  2. Why are some fast-food restaurants moving toward no indoor dining areas?

OM in the News: The Airline Boarding Process

United Airlines has a plan to fix one of the most annoying parts of travel: boarding, writes The Wall Street Journal (Oct. 19, 2023).  United is bringing back a boarding method for passengers that it says is more efficient, hoping to shave up to 2 minutes off what is often a contentious process. It sounds simple: window, middle, aisle, or “Wilma.” When economy passengers board, those sitting in the window seat will go first, followed by middle seats, then aisles. Groups traveling on the same reservation will still board together.

Airplane boarding has become a Byzantine OM process that can frustrate customers and put airlines behind schedule, causing delays that can ripple throughout the day. We deal with this topic in Chapter 7, where five process and analysis techniques are introduced (see pages 284-288).

For airlines, boarding is a logistical puzzle as well as a psychological test as they try to balance speed, fairness and revenue. Earlier access to overhead bin space is often a perk for higher paying customers, who clamor to get on first. Carriers have tried tweaks like better signage and text-message alerts about when to head to the gate. The number of boarding groups has proliferated as airlines have sought to reward loyal customers, military, handicapped, etc., while keeping things running more smoothly.

 No matter what, crowding at gates and logjams on jet bridges seem inevitable. United said things have gotten even worse as travel has rebounded from the pandemic. Boarding times have increased by up to two minutes since 2019.

United has used the Wilma process before: But in 2017, it combined middle and aisle seats into a single group. Now, economy passengers in dreaded middle seats will board after those with window seats, followed by those with aisle seats. Basic Economy passengers will have their own newly created group and will be the last to get on the plane.

All airlines find that small reductions in that “turn” time can add up over the course of the day and allow for more flying, and all have different theories on the speediest procedure. But it seems no airline has found a panacea.

Classroom discussion questions:

  1. Check out some of our earlier posts on the topic by using the search engine on the right. Summarize the approaches tried.
  2. How would you tackle this problem as operations manger of an airline?

Guest Post: Lobsters, Shrinkage, Process, and the Supply Chain

Our Guest Post today comes from Howard Weiss, Professor of Operations Management Emeritus at Temple University.

In Chapter 12’s discussion of inventory, your Heizer/Render/Munson textbook discusses shrinkage and notes that shrinkage is “inventory that is unaccounted for between receipt and time of sale, and occurs due to damage and theft as well as sloppy paperwork.” Shrinkage does not have to occur at any one particular facility but can occur at multiple points throughout the supply chain. A prime example of this is what happens with lobsters.

The usual steps in getting a live lobster from Maine to a restaurant are:
 Catch the lobster in a lobster trap
 Transfer the lobster to the to the ship’s storage well
 Transport the lobster to storage at the wharf
 Truck the lobsters to a dealer
 Transport the lobster to a restaurant
Shrinkage occurs because lobsters die as they move through the supply chain. Each 1% in shrinkage equates to a $5,000,000 loss in sales.

The goal of Process Analysis, as explained in Chapter 7, is to “continuously improve the process.” Currently, researchers at the University of Maine are doing just that by studying the above supply chain in order to try to reduce the time involved in any of the steps and determine which steps would give the greatest benefit if the time is reduced.

Of course, not all lobsters are shipped live and follow the steps above. Some lobsters are euthanized then sent to a processing plant where tails are separated from the rest of the lobster which is processed to produce raw lobster meat. In addition, during the pandemic some fisherman have resorted to selling the lobsters directly to local restaurants or consumers.

Classroom discussion questions:

  1. What factors would be important when shipping live lobsters?
  2. What Ch.7 process analysis tool would be most useful for improving the process?

OM in the News: Time & Motion Studies and Knee Surgery

“Competitive forces are out of whack in health care,” writes The Wall Street Journal (Aug. 22, 2018). Hospitals are often ignorant about their actual costs. Instead, they often increase prices to meet profit targets. For nearly a decade, Gundersen Health System’s hospital in Wisconsin boosted the price of knee-replacement surgery 3% a year till the list price was more than $50,000, including the doctors. Yet administrators admitted they had no idea what it cost to perform the surgery—the most common for hospitals outside of childbirth.

So during an 18-month review, a Time & Motion expert trailed doctors and nurses to record every minute of activity and note instruments, resources and medicines used. The hospital tallied the time nurses spent wheeling around VCR carts, a mismatch of available postsurgery beds, unnecessarily costly bone cement, and delays dispatching physical therapists to get patients moving. The actual cost? $10,550–everything included. On average, a nurse assistant needed 10 minutes to collect personal items from patients before surgery. A technician took another 20 minutes to insert an IV into patients. Time spent in Gundersen’s operating room—the most expensive minutes of a patient’s hospital visit—averaged 95 to 105 minutes.

On busy days, the hospital had no available beds for knee-replacement patients after surgery. Patients with nowhere to go remained in temporary postsurgical units for as long as 24 hours, prolonging their recovery. Also, the hospital had been exclusively using brand-name cement, premixed with antibiotics. It slashed its cement costs by 57% by switching to a generic, which can be used with the same results. Changes to this series of processes means the knee surgery now costs the hospital an average of $8,700 to perform, an 18% savings. The more Gundersen wrings from its costs, the more profit it earns.

It turns out that on knee-replacement surgery, higher-cost U.S. hospitals spent almost twice the amount lower-cost hospitals spent, despite similar quality and comparable patients.

Classroom discussion questions:

  1. What tools in Chapter 10 were likely used in this study?
  2. What might be the hospital’s next step to improve operational efficiency?

OM in the News: TSA Turns to OM, and Improves Queue Times

HIDE CAPTION Peak wait times measured by airport officials at Chicago O’Hare International Airport, pictured May 16, fell from 105 minutes in early May to just nine minutes in the two weeks before the Fourth of July
Peak wait times at Chicago O’Hare Airport fell from 105 minutes in May to just 9 minutes in late June

After hours long lines at some airports and public outrage over stranded passengers, the beleaguered Transportation Security Administration (TSA) just pulled off a major restructuring, dramatically reducing wait times even as summer air travel surged to record levels. Nationally, over the 4th of July, wait times averaged 10 minutes and PreCheck lines averaged 5 minutes.

“How TSA dug out of its checkpoint quagmire is both a remarkable story of rare, quick change inside a big government agency,” writes the Wall Street Journal (July 21, 2016)–and it all involved a series of basic OM analyses that your students could have developed. Here are some of the TSA changes:

  1. Put more agents on passenger screening checkpoints.
  2. Provided a barrel to dump out water bottles before they went through X-ray machines and brought screening to a halt.
  3. Added 600 contract workers to move bins and direct passengers so TSA screeners (who used to do that) could go back to screening and open more lanes.
  4. Created a maintenance desk in each command center to quickly dispatch techs instead of the old process of writing a repair ticket and waiting.
  5. Summer vacations for screeners were limited; nonessential training was deferred.
  6. Slightly increased the number of people selected to get PreCheck printed on boarding passes.
  7. Created a Central Command Center which hosts daily conference calls with local directors, airports and airlines. Here they share best practices and coordinate efforts, shifting staff at airports with multiple terminals and regions with multiple airports as needed.

“We completely changed the way we operate,” said TSA’s administrator.

Classroom discussion questions:

  1. Can students expand this list with more suggestions?
  2. What will happen in Fall, when short-term fixes like overtime, delayed vacations and training, etc., dissolve?

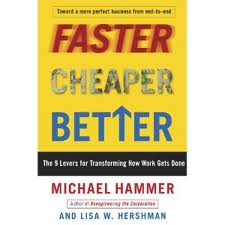
Good OM Reading: Faster, Cheaper, Better

I know I have finished a good book about OM when I see just how many pages I have highlighted in yellow marker. Faster, Cheaper, Better, by Michael Hammer and Lisa Hershman (Crown Business,2010), is such a book. Hammer, you may recall, was coauthor of the 1993 blockbuster, Reengineering the Corporation, which galvanized companies to rethink every aspect of operations. He was a rare genius, whose recent death was a major loss to our field.

Faster, Cheaper, Better focuses on end-to-end processes, how to shed tasks that don’t add value, and how to let workers make decisions. This is not a book for undergrads, but I would recommend assigning it if you are teaching a class of EMBAs.

The strength of the book is its real-world case studies (Tetra Pak, Clorox,  Gamesa, to name a few). For a quick overview, just read the 1st four chapters and some of the cases. Here are 2 good quotes:

From the Shell Oil CEO regarding the transformation process: “We are going on a journey. On this journey we will carry the wounded and shoot the stragglers”.

About the automated factory of the (near) future: “There will be only 2 living creatures in it: a man and a dog. The man’s job will be to feed the dog, and the dog’s job will be to make sure the man doesn’t touch the equipment”.

My favorite story in the book, though, is about how precisely to perform a step in a process. Hammer gives the example of hospital bills that go on for pages, with reams of line items, including such things as tissues and pills. “Pareto was an optimist”, he writes. “His 80-20 rule is really more like 95-5 for a hospital”. After Hammer finished his process analysis, the hospital stopped collecting data on, or bill for, items costing less than $25. This reduced nurse overtime, and the hospital simply averaged the misc. costs into the basic room rate.

Video Tip: Flowcharting at Arnold Palmer Hospital

Many of our colleagues think flowcharting is an invaluable tools we should be teaching in OM. I agree, and every semester I show the video Process Analysis at Arnold Palmer Hospital (7 min.).

APH believes that if a process takes place more than one time, it should be documented and flowcharted. There is even a staffer shown in the film, Diane Bowles, with the job title “Clinical Practice Improvement Consultant”, whose full-time work is charting scores of processes.

After I show the video in class, I assign small teams to flowchart the process of maternity patients moving through the hospital (see the video case at the end of Chapter 7). The Solutions Manual shows one possible chart. When you show the video, ask the students about the pre-registration function, how it can be used to streamline the operation, and why pregnant women benefit from it.

The key is that continuous improvement helps both patient and hospital function/efficiency.