OM in the News: Productivity and Technology Down on the Farm

An Iowa farmer using tractor-mounted computers to help make decisions about planting crops

We are fully aware that few of our students will be entering jobs in agriculture (see Figure 1.5  in Chapter 1 for employment figures in the U.S. manufacturing, service, and farm sectors). Yet this Wall Street Journal (Feb. 26, 2014) article on the next revolution on the farm is still worth sharing with your class. The revolution will come from feeding data gathered by tractors and other machinery into computers that tell farmers how to increase their output of crops like corn and soybeans.

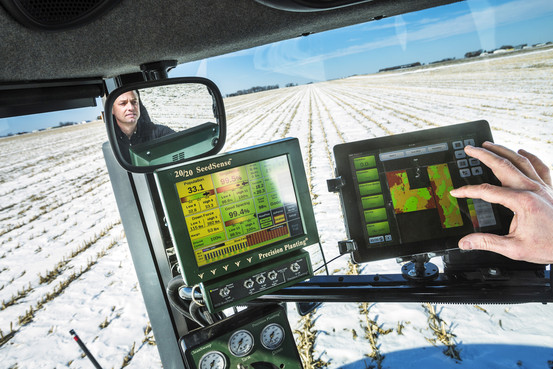
Monsanto, DuPont, and other companies are racing to roll out “prescriptive planting” technology to farmers across the U.S. who know from years of experience that tiny adjustments in planting depth or the distance between crop rows can make a big difference in revenue at harvest time. Many tractors and combines already are guided by Global Positioning System satellites that plant ever-straighter rows while farmers, freed from steering, monitor progress on iPads and other tablet computers now common in tractor cabs. The same machinery collects data on crops and soil. But many farmers have haphazardly managed the information, scattered in piles of paperwork in their offices or stored on thumb drives clattering in their pickup truck ashtrays.

Algorithms and human experts crunch all the data and can zap advice directly to farmers and their machines. Supporters say the push could be as important as the development of mechanized modified seeds in the 1990s. Data-driven planting advice to farmers could increase world-wide crop production by about $20 billion a year, or about one-third the value of last year’s U.S. corn crop. The technology could help improve the average corn harvest to more than 200 bushels an acre from the current 160 bushels. Such a gain would generate an extra $182 an acre in revenue for farmers.

Classroom discussion questions:
1. Why are farmers concerned about Monsanto’s involvement?

2. How has productivity improved over the past decades on farms?

Guest Post: Total Cost of Ownership

john bowlerOur Guest Post today comes  from John Bowler, who is Visiting Professor at DeVry University’ s College of Business.

As the Heizer/Render OM text suggests in Chapter 11, the collaborative relationship between buyer and supplier should yield the lowest total cost of ownership (TCO). TCO is the sum of all direct, indirect, and opportunity costs over the life cycle of a purchase. The goal of the TCO approach is to obtain the most economical total price and not necessarily the lowest initial price. This is the focus of many successful collaborative supplier-client relationships.

The elements of TCO are (but not limited to): Item price; Item ordering cost; Transportation costs; Receiving costs; Inventory carrying cost; Shortage cost; Warranty cost; and Aftermarket/preventative maintenance cost.

TCO composition varies by the type of product, the product’s life-cycle stage, supplier’s location, the buyer’s production methodology and/or method of service delivery. Determining the TCO can be a challenging task. One way to start is to identify the supplier’s costs (or contributions) in regard to the following:

  • Integration relates to how well the supplier meshes with the buyer’s established infrastructure and processes to include the ease by which information flows both ways between buyer and the supplier. In today’s supply chain, timely and accessible information flow is very much as important as on time, in spec, delivery of the product or service.
  • Collaboration relates to the ease of doing business with the supplier.
  • Synchronization refers to supply chain capabilities such as the flexibility to drop ship direct to the end user.
  • Leverage focuses relates to the competitive advantage a supplier contributes to the client’s competitive capabilities.
  • Acceptable risk relates to the level of the supplier’s reliability and resiliency in supporting the buyer’s ability to maximize chosen profit opportunities.

TCO data-driven conclusions provide a competitive advantage to firms across various industries. Thinking outside the box of ways to maximize profitability in supplier relationships rather than calculating ways to minimize supplier costs will earmark industry leaders in the future.

OM in the News: The Case of the Vanishing Drugs

The Aethon Tug mobile robot delivering meds at U. of Maryland hospital

“Hospitals have a drug problem.,” writes The Wall Street Journal (Feb. 24, 2014),  “and they’re looking to technology to solve it.” The problem is the way medications are being mishandled by hospital pharmacies and wards. Inventory management is inefficient, drugs are too often misplaced, and narcotic medications are prone to theft.  In addition to turning to password-protected dispensing machines, RFID tags and roaming robots to deliver prescriptions, hospitals are adopting software that tracks every dose of medication to identify suspicious activity.

By making it easier to track medicines, the changes give nurses more time to spend with patients. Mercy Hospital in St. Louis, for example, estimates that its medication-tracking system saves the hospital $600,000 a year just in time lost from pharmacists, technicians and nurses locating meds. The new systems also help improve patient safety by identifying staffers who are siphoning drugs for their own use, a problem known as “diversion.” About 15% of health-care professionals are addicted to prescription drugs at some point in their career. These drug-related inventory losses cost millions each year. The software also allow hospitals to better manage inventory by not stocking medicines that are never used, or by keeping just enough of expensive drugs on hand to meet demand.

At the University of Maryland Medical Center, mobile robots deliver medications to nursing units. Pharmacy staffers print a label, scan and place the medication in one of the robot’s locked drawers, and then enter a destination into a program that communicates wirelessly with the robot. The robot navigates its way to the right unit, where a nurse uses a passcode and fingerprint scanner to retrieve the medication. Delivery reliability—how often the drugs arrive at the unit as promised—has increased by 23%, and delivery predictability—how often they get there within the time promised—has risen by 50%. The per-trip cost with a robot averages $2.40, down from $5.50 for hand delivery, and in its first year the system freed up 6,123 hours of nurses’ time.

Classroom discussion questions:

1. Why is inventory control so important in hospitals?

2. What is the danger of “diversion”?

OM in the News: Wal-Mart Ramps Up Global E-Commerce

A worker at Wal-Mart's "dark store" in Mexico City
A worker at Wal-Mart’s “dark store” in Mexico City

Wal-Mart says it has cracked the code for speedy, same-day grocery delivery—in Mexico. As retailers like Wal-Mart and Amazon.com rush to expand home delivery in the U.S. to groceries, the retail giant is looking across the border for help: Its high-end Mexican grocery chain, Superama, already delivers groceries in as little as 3 hours.

Wal-Mart has ramped up its global e-commerce operations over the past few years, writes The Wall Street Journal (Feb. 19, 2014), in hopes of catching up to online rival Amazon.com. The company vowed to match Amazon’s service offerings within 2 years. Currently, only about 2% of Wal-Mart’s sales come from the Web.

The company has been testing home-grocery delivery in Colorado and California, but it hasn’t announced a timeline for taking the service nationwide. It is also experimenting with grocery delivery in such cities as Buenos Aires and Santiago, Chile. Wal-Mart says it is “committed to being the online global leader in grocery delivery.”

Mexico provides $27 billion in sales and contributes 6% of the company’s global sales. Superama helped Wal-Mart achieve a 92% market share in the home delivery of groceries in Mexico. A fifth of its grocery orders arrive via mobile-phone apps, computers and tablets. The service is strongest in Mexico City, where much of Mexico’s wealth is concentrated. The capital’s snarled traffic and cramped grocery stores make delivery from Superama appealing for the well-to-do.

The majority of the grocery deliveries in Mexico come from supermarkets that are open to the public. But in the future, Wal-Mart de México plans to deploy more “dark stores”— spaces used exclusively to fulfill online orders. Such “closed” stores are more efficient: Wal-Mart’s inaugural dark store in Mexico City handles the same volume of orders as 5 stores open to the public.

Classroom discussion questions:
1. Why is Wal-Mart pursuing this global strategy?
2. What has happened to previous firms who entered the on-line grocery business in the US?

OM in the News: Debugging the New Airbus A350 Jet

The A350's curved wingtips reduce drag and increase fuel efficiency
The A350’s curved wingtips reduce drag and increase fuel efficiency

“A million parts, flying in tight formation,” is how BusinessWeek (Feb.17-23, 2014) describes the debugging of Airbus’ latest new plane, the A350. The European company desperately wants to avoid the kinds of problems that have plagued rival Boeing’s 787 Dreamliner. After several production fiascoes, the 787 endured further problems when its lithium-ion battery packs burst into flame. For the A350 to be economically viable, says Airbus, “the airlines need an operational reliability above 99 percent.” That means that no more than one flight out of every 100 is delayed by more than 15 minutes because of technical reasons.

To ferret out the flaws in an airplane, Airbus technicians have come to depend on sophisticated computer systems. These, too, can introduce problems. Like the A350, the A380 superjumbo was designed entirely on computers, but engineers working in the company’s German and French operations hadn’t used the same versions of the design software. When assembly line workers started installing bundles of wires, they discovered that the German software had miscalculated the amount of wiring needed for the fuselage, which had been designed on French software. Miles of wiring turned out to be too short and had to be torn out from half-completed airframes and replaced.  In 2011 and 2012, cracks were found within the A380’s wings, prompting authorities to order the entire fleet to undergo detailed inspection of the structural integrity of the plane. To minimize the chances of that occurring in the A350, Airbus is putting the airframe sections through more than 80,000 simulated takeoff and landing cycles.

But much of the work is done by suppliers, not by Airbus itself. While the company might look to the outside world like an aircraft manufacturer, it’s more of an integrator: It creates the overall plan, then outsources the design and manufacture of the parts, which are then fitted together. “We have 7,000 engineers working on the A350,” says Airbus, “and at least half of them are not Airbus employees.”

Classroom discussion questions:

1. Why was development of this new plane so difficult?

2. Why did Airbus decide to make a new plane, as opposed to migrating from an older model such as the A330 (see Chapter 5)?

OM in the News: Why the VW Vote to Reject a Union is Big News

vwAs we note in Chapter 8, Location Strategies, the presence of labor unions can have a major impact on a company’s decision where to locate a manufacturing plant. So when workers at the Tennessee VW auto factory voted 712 to 626 last week against joining the United Automobile Workers, it was national news. VW did not oppose unionization, reports The New York Times (Feb. 17, 2014), and seemed to give tacit approval for unionization as a step toward establishing a “works council” at the plant. A works council is a committee, common at German factories, in which white-collar and blue-collar workers elect representatives who establish policies on issues like work hours, vacations and standards for firing workers. But it would be illegal under U.S. law for a company to establish a works council unless workers first voted to have a union represent them. Had a works council been set up at the VW plant, it would have been the first in the U.S.

U.A.W. officials were stunned by the defeat; they had expected to win because VW was not fighting the effort and, just months before, a majority of the plant’s employees had signed cards saying they favored union representation. One industry expert called the loss “a very serious setback for the union, a setback that will resonate throughout the South.” The U.A.W. campaign was clearly hurt by the anti-union sentiment common in the South, as well as an intense campaign by anti-union workers inside the plant who argued that they did not need a union or union dues because VW already treated and paid them well. Wages at the plant average $19.50 an hour.

Union officials accused Tennessee Senator Bob Corker of poisoning the atmosphere and preventing a fair election before the vote. Corker had told the media that VW had assured him they would add another production line at the plant (instead of going to Mexico) to make a new SUV if the factory’s workers rejected the union. This story can make for a lively class discussion of incentives, unions, worker rights, and more.

Classroom discussion questions:

1. Why did state officials take a position against the union vote?

2. Why did VW encourage creation of a works council?

Guest Post: A Class Exercise Relating Productivity and the Olympics

HowardWeiss2Howard Weiss is Professor of Operations Management at Temple University. He has developed both POM for Windows and Excel OM for our text
When I teach productivity, I like to explain to the students that while output/input seems simple, it can be difficult to assess.  The Heizer/Render textbook includes multifactor productivity (Chapter 1) where the multiple factors are all inputs, and I like to ask my students to take it a step further.

There are many web sites that list the Olympic medal count for any Olympics. I show my students the top medal-winning countries from one of the more recent Olympics, such as those listed at http://en.wikipedia.org/wiki/2012_Summer_Olympics_medal_table.

When I am in the classroom I ask my students, “What information would you want in order to answer the question, “Which of the 5 countries shown below was the most productive in the 2012 Olympics?” This raises many interesting issues. Students will discuss the different inputs that might be used such as population, dollars spent training the Olympians and number of athletes competing. Some students will note that different outputs can be used. For example, outputs could be total medals or a weighted average of gold, silver and bronze medals. For the 2012 Olympics, I point out that based on the sorting in Wikipedia, it is using only gold measures, as its output measure as can be seen when comparing Great Britain and Russia or South Korea and Germany.

I also ask the students to find websites that list the countries in a manner that we would call productivity. This web site has a graph of the top 8 countries based on medals per athlete while this one includes the inverse of productivity in its table on athletes per medal.

The students generally find this to be a fun exercise and appreciate that inputs and outputs may not be as simple as one might think. In the course of searching for Olympic productivity on web sites, they also find sites that are interesting even though the site does not answer the productivity question. One example is this site, which explains that American workers are less productive during the Olympics. Finally, the exercise was very timely this past week since the Olympics are currently going on.

OM in the News: The Logistics of Valentine’s Day Roses

Valentine_RoseU.S. consumers buy the most flowers on Valentine’s and Mother’s Days–and getting fresh roses to market takes speed, the right temperature, and skill. Like all perishable products, flowers require specific temperatures to maintain freshness, without which they will lose their bloom.

Complicating this need for the ideal temperature, flowers travel a long way from field to store reports Supply Chain 24/7 (Feb. 13, 2014). Eighty percent of all flowers sold for Valentine’s Day are shipped from Latin America, with 12% coming from domestic production and 8% arriving from other locations. In 2013, there were over 231,000  bushels of roses imported into the U.S. from Latin America. Most of these came from Colombia (142,000) and Ecuador (79,000).

Shipping starts weeks before the holiday and the best flowers arrive early. The graphic shows the 2-week path of a rose, from the fields of Latin America to the hands of its recipient.

Classroom discussion questions:

1. What are the risks to this supply chain (see Chapter 11)?

2. How does the supply chain for flowers differ from that of clothes made in Asia?

OM in the News: Heinz Goes on a Diet

Heinz's Pocatello factory scheduled for closure
Heinz’s Pocatello factory scheduled for closure

For years, H.J. Heinz Co. managers considered their frozen-food plant in Pocatello, Idaho, the heart of potato country, a model factory, ranking it the best in the U.S. in 2009 and 2011 for safety, cleanliness and efficiency. But in November, 2013, Heinz said it would close the Idaho plant this year. It may have been a model factory, writes The Wall Street Journal (Feb.11, 2014), but it also was an example of the kind of dubious logistics that were costing Heinz money. Frozen enchiladas, for instance, were trucked nearly 1,000 miles from a factory in San Diego, packaged with rice and sauce by workers in Pocatello then shipped across the country to distribution centers on the East Coast.

The market for packaged frozen foods had been hit hard by a broad consumer shift to fresher foods. And Heinz had too much production capacity in that sector. It had built a new frozen-food factory in South Carolina in 2009. Moreover, Pocatello was situated far from Heinz’s other factories and from its main markets. Roughly 70% of all ingredients used in the factory are shipped in from east of the Mississippi, well over 1,000 miles away. Others came from Denver, nearly 600 miles to the south.

A similar announcement at another plant last November proved tumultuous. Managers at a century-old Heinz ketchup factory in Leamington, Ontario, told several hundred employees that their plant also was to be closed. Some started cursing, crying and knocking over chairs, and others stormed out. The company will consolidate its frozen-meal operations at its factory in Ohio, which, according to its spokesperson, is “the most central location to customers, distributors and the supplies we need.” He added that the decision to close the Idaho plant “is based primarily on factory location in relation to our customer/consumer base and the need to improve transportation efficiencies and the fact we have we have excess frozen manufacturing capacity.”

Classroom discussion questions:

1. Why is Heinz closing the two factories?

2. Which of the factors that affect location decisions (see Chapter 8) influenced Heinz?

OM in the News: Jet Blue’s Unique Revenue Management Strategy

jet blueOne of the financial tricks in an airline’s tool kit is to sell more tickets than there are seats on a plane. If there are 150 seats, sell 175 tickets—people miss flights for a myriad of reasons and gate agents can typically muster enough volunteers who will take a later flight for a discount voucher. Yet this process doesn’t play out at JetBlue Airways, reports BusinessWeek (Feb. 5, 2014),  which has shunned “bumping” since its first flight 14 years ago. “Our traditional mission is to bring humanity back to air travel, and we feel that customers that purchase a seat should get a seat,” says the firm’s spokeswoman. It seems like a kinder way to treat travelers, but it might not be a smart way to run an airline.

The ultimate goal is to fill every seat on every flight, preferably in the order of who paid the most. Travelers flying on the lowest fares are those who also tend to volunteer their seats for compensation, while customers who pay the most—usually business travelers—can’t be tempted out of their seats. Overbooking pays off too: airlines almost always make more from the extra fares than they give back to volunteers in future-travel vouchers.

Yet because airlines have amassed years of detailed data on passenger no-shows—down to days, times, seasons, and specific routes—they only rarely need to write customers checks. The data also help them to know how to tweak their oversales for each flight, part of the complex algorithms that power revenue-management systems, the backbone of airlines’ fare pricing. Because it doesn’t overbook, JetBlue enjoys the lowest rate of involuntary denied boardings in the industry: only 18 people out of 21.3 million passengers through the first three quarters of 2013. On the other end of the spectrum, AirTran Airways had 1.28 passengers bumped for every 10,000 travelers (or 1,800 customers in total during the period).

Classroom discussion questions:

1. Should Jet Blue overbook, like other carriers do?

2. What other service industry overbooks?

OM in the News: Using Regression Analysis to Forecast Olympic Medals

olympicsHow many medals will the U.S. walk away with at this year’s Winter Olympics? What about perennial runner-up China? Two brothers, writes Fast Company (Feb. 7, 2014), have the answers. Since the 2010 Winter games, the two collected more than 30 datasets and ran regression after regression until they found a model that accurately matched the past two Winter Olympics.  According to Tim and Dan Graettingers’ model, the U.S. will walk away once more with the most overall medals, though it won’t come close to last Olympic’s record-setting 37 individual awards.  China, which only won 11 medals in the last Winter Games, is set to double its haul.

For the final model, the Graettingers found that only four variables consistently predicted a country’s medal count in the Olympics (with an R-squared of .585):

Geographic area – Their best guess is that it may reflect the nation’s population and/or the genetic diversity within the nation and/or the presence of mountain ranges on which to ski and snowboard.  Also, it does separate the relatively larger nations of the world from the many small (geographically and population-wise) island nations in the Caribbean and the Pacific.

GDP per capita –  It seems to confirm the hunch that nations whose people are affluent can afford to spend time pursuing excellence in sports, while poorer nations cannot.

Value of Exports – This measure of a nation’s total economic power seems to complement per capita GDP.

Latitude of Nation’s Capital –  The further your country is from the equator, the more snow and ice you’ll have – and the more medals you’ll win at sports contested on snow and ice.

By the way, no nation from Africa, South America, or the Middle East has ever won a medal at the Winter Olympic Games.  No nation from the Caribbean has either, despite the worthy efforts of the Jamaican bobsled team!

Classroom discussion questions:

1. What are the strengths and weaknesses of this model?

2. How accurate were the brother’s forecasts when the final 2014 tally was completed at the end of the games? (Here is a link to their country by country forecasts).

OM in the News: Chipotle’s Operations Strategy for Faster Service

chipotle-serviceLines snaking out the door at lunchtime have long been a bottleneck to growth at Chipotle, the burrito chain, writes Quartz.com (Jan. 31, 2014).But the fast-food firm managed to speed up service by 6 transactions per hour at peak times this past quarter by implementing what it calls the “four pillars of great throughput.” Here they are:

+“Expediters.” That would be the extra person between the one who rolls your burrito and the one who rings up your order. Her job? Getting your drink, asking whether your order is for here or to go, and bagging your food.
+“Linebackers.” The people who patrol the countertops, serving-ware, and bins of food, so the ones who are actually serving customers never turn their backs on them.
+Mise en place.” What in a regular restaurant means setting out ingredients and utensils ready for use means, in Chipotle’s case, zero tolerance for not having absolutely everything in place ahead of lunch and dinner rush hours.
+“Aces in their places.” A commitment to having what each branch considers its top servers in the most important positions at peak times, so there are no trainees working at burrito rush hour.
Chipotle is also mulling incorporating a Starbucks-style mobile payment system (the chain already accepts online orders for pick-up), which the company is hopeful will help funnel customers in and out of its lines a bit faster. But the company is open to a number of other options, too, so long as they help speed up service.
Classroom discussion questions:
1. Which of the techniques for improving service productivity in Chapter 7’s Table 7.3 is Chipotle using?
2. Which Process-Chain-Network (PCN) Analysis domain (see Figure 5.12 in Chapter 5) best describes Chipotle?

OM in the News: A Cure for Hospital Design

Directional guiding hospital kiosk

Endless corridors that seem to lead nowhere. Poorly marked entrances. Multiple elevator banks and incomprehensible signs. “Hospitals,” writes The Wall Street Journal (Feb. 4, 2014), ” are realizing they have a design problem as patients and visitors struggle to navigate the maze of the modern medical complex.” Confusing layouts and signage add to patients’ anxiety at a time when many are feeling ill and are coming to the hospital to undergo tests and procedures.

Now, many hospitals are borrowing strategies from shopping malls and airports to make it easier for people to get around—a process design experts call wayfinding. Technical names for departments, such as Otolaryngology, are being replaced on signs with plain language—Ear, Nose and Throat.

Confusing layouts can result from years of hospital renovations and building additions. When hospitals expand they often fail to update their signs for multiple new entrances, wings and unconnected buildings. At Rapid City Regional Hospital in South Dakota, patients from distant ranching and farming communities frequently complained about finding their way through the 650,000-square-foot complex. So medical jargon directing patients to Antepartum and Postpartum services, for instance, was changed to Labor and Delivery. The Rapid City hospital, which spent about $300,000 on its wayfinding project, installed direction-finding digital information kiosks at each of the three entrances. Different patient areas were given a different color code. If patients or visitors look lost, employees are expected to stop what they are doing and offer to help, even to escort them to their destination.

Universal symbols to help people find departments have caught on in some hospitals, especially when patients speak various languages. The symbols, such as a teddy bear to signal the pediatrics department, have reduced patient confusion at Children’s Mercy Hospital in Kansas City.

Classroom discussion questions:

1. Why are hospital layouts often confusing?

2. What can be done, besides the ideas noted in the WSJ, to improve flows?

OM in the News: Harley-Davidson’s Manufacturing Strategy

harley2“Before the great recession, Harley-Davidson didn’t have to worry about counting the seconds,” writes The New York Times (Feb. 2, 2014). There was little competition for their core customers — “fat white guys,” as one employee called them. Harley charged a huge premium for its bikes, and its customers waited as long as 18 months to receive them. The union rep at Harley’s York plant said workers could assemble motorcycles at their own pace, music blaring. “We had 30% absenteeism every Monday and Friday,” added the plant manager. This all worked fine until the recession, when the company was close to collapse.

Many firms respond to global competition by breaking their unions, by moving to a right-to-work state (or out of the country), and by employing robots on the assembly line. But Harley has an “American blue-collar, working man” brand, and to get rid of its union or to make its motorcycles in Mexico would have been catastrophic. The company could only compete by redesigning the production system so that each worker created more value than they cost. So Harley tore down the existing plant and built a new one. Unlike most factories, the new plant has people everywhere. There are no robots on the main assembly line; instead, hundreds of workers, operating in teams of 5 or 6, manually build each motorcycle. There are around 1,200 different Harley configurations, and a new bike starts its way through the production line every 80 seconds. Virtually each one is unique.

Human beings can also solve thorny problems that lead to major inefficiencies. At Harley, there are 150 “problem solvers” whose entire job is to continuously monitor their small sections of the production line and search for better ways to make motorcycles. The average tenure of a line worker at the York plant is 18 years, and these workers are extremely devoted to the company. (“How many factory workers have the company logo tattooed on their arm?” asks the plant manager.) Costs have fallen by $100 million at the plant and quality has improved even more significantly. Customer demand is extremely high, especially now that people can get a bike within a few weeks.

Classroom discussion questions:

1. What type of production process does Harley use? (See the Global Company Profile that opens Ch. 7).

2. Why does Harley prefer people to robots?

OM in the News: America’s Second Railroad Revolution

Union Pacific's Bailey Yard
Union Pacific’s Bailey Yard

Rail is on a roll in the U.S. As Forbes (Feb.10, 2014) writes, “The relic of the 19th century will become the most important logistics system of the 21st century.” Thanks to leaps in technology, more and more freight traffic has moved from roads to rails, where trains can move one ton of goods about 500 miles on a single gallon of fuel. The industry, so recently an aging also-ran in the age of superhighways, has seen revenues surge 19% to $80.6 billion since 2009, creating 10,000 new jobs at railroad companies. Less than a decade ago diesel prices were so low that manufacturers rarely considered rail for shipments of less than 1,000 miles. Now they’re ditching trucks in favor of trains for jobs as short as 500 miles.

All of which is driving a multibillion-dollar revival in rail R&D and infrastructure, investment unseen in America since the transcontinental railroad. Thousands of new state-of-the-art locomotives–far more fuel-efficient and less polluting than the ones they replace–are now operating on U.S. railroads. And the boom (with $20 billion in infrastructure spending annually) has been underwritten by industry, with no cost to taxpayers. Further, the Rail Safety Improvement Act of 2008 required railroads to fund, build and implement a new, safer “Positive Train Control” system by the end of 2015, refitting locomotives and tracks, and placing GPS devices on every locomotive.

This technology has been revolutionizing freight hauling, allowing the railroads to pinpoint a locomotive’s location within one yard. And instead of sending trains speeding across the country only to stop at each red signal, the new system means conductors will be able to know about planned stops well in advance, allowing them to simply reduce speed (and fuel consumption) to a level that won’t force them to stop altogether and burn major amounts of fuel when restarting from a standstill.

Classroom discussion questions:

1. Why are these changes in the rail industry important to operations managers?

2. What new technology is GE using in locomotives which will be 50% cheaper than diesel?