Guest Post: Another Successful Semester with MyOMLab at Temple U.


HowardWeiss2Howard Weiss is Professor of Operations Management at Temple University. He has developed both POM for Windows and Excel OM for our text

In the past, I have guest posted about my students’ appreciation of MyOMLab– and that appreciation is even greater now! At the beginning of the semester I always ask students about any experiences they have had with the MyLabs. This semester, for the first time, well more than half the class had previously used at least one of the following; MyAccountingLab, MyMarketingLab , MyMISLab or MyStatLab. These students were already familiar with the MyOMLab structure so they could use it with no explanation. Further, about 1/4 of the students were concurrently enrolled in MyFinanceLab and MyOMLab. This makes for a single sign-on to get to both courses; and the synergy among all these labs greatly improves the students’ experiences and productivity.

Past students had commented that the exams were not like the homework in that students could not redo problems on the exams while they could on the homework. Because of their observation, for each topic this semester I gave both homework and a quiz on MyOMLab. The students very much liked having the dual assignments each week.

My courses this semester were online/hybrid courses. While using MyOMLab makes homework grading easier in face-to-face classes it is even better in online sections because it enables homework submission without the students having to send me an email with attachments as they had done in past online sections.

Even though the course is online I do give my exams face-to-face. From the onset of my usage of MyOMLab the students have very much liked getting the exam results immediately after completing the exam. My better students review their exams after getting the grade and ask me questions about their mistakes. This seldom happened when I gave final exams because the students never saw their graded exams. Reviewing the exam makes for a great learning experience. After all, one of the best ways to learn is from our mistakes.


Guest Post: MyOMLab Provides Demonstrated Learning

LAFishOur Guest Post today comes from Dr. Lynn A. Fish, who is Professor of Management at Canisius College.

As the educational world continues to add more online elements, I remained skeptical of the educational value and security issues associated with these systems. However, when it became obvious that students were merely copying homework from one another and I faced a course overload, it became clear that something radical needed to be done. While one can argue for or against the need for homework, I’ve always been a proponent of using it. So, I blindly entered the world of online homework in fall 2011. As a ‘techno-jinx’, I held my breath waiting for trouble to break out. It didn’t!  Students seemed to adapt to it with very little difficulty.

Over the past 6 semesters, I have surveyed students on course specifics including MyOMLab homework. The majority indicate that MyOMLab is easy to use or they are able to overcome the minor issues. The most common minor issues students cited are rounding and decimal issues. From my standpoint, using MyOMLab allows each student to have different problems (algorithmic setting), requires less time for grading, and gives students immediate feedback. The ability to review each student’s assignment is available, but I find it unrewarding and time intensive to review. However, when a student is struggling, I can assist him with a particular problem from virtually anywhere in the world.

As a skeptic, I wondered whether the MyOMLab system offered educational value. After asking for student permission, I analyzed the relationship between MyOMLab and in-class performance. At an overview level, mild to moderate correlation exists. When analyzing further, there is definitely learning occurring through the MyOMLab system – at the scaffold level.

In conclusion, through student surveys, I’ve surmised that they find the MyOMLab acceptable, and through my own analysis, I’ve concluded that learning is in fact occurring. End result: win-win!


Guest Post: Building Furniture in a Linear Programming Class

Bob DonnellyToday’s Guest Post is by Dr. Robert Donnelly, Professor of Management at Goldey-Beacom College, in Delaware, who describes one exercise he uses to teach LP (Module B).

One of the challenges of teaching linear programming is the intangible nature of the topic which causes many students to have anxiety. One method that I use in my LP class is to pass out 6 large and 8 small Duplo-sized Legos to small groups of students and ask them to build tables and chairs. This is an example of a product mix problem with the objective of maximizing profit.

LP exampleAs you can see, each table has 2 large and 2 small blocks while each chair has 1 large and 2 small blocks. Each table contributes $16 in profit while each chair contributes $10 in profit.

Tables

Chairs

Availability

Large Blocks

2

1

6

Small Blocks

2

2

8

Profit

$16

$10

I start a class discussion on the feasible solutions that were discovered along the way to the optimal solution, which is to produce 2 tables and 2 chairs earning a profit of $52.

Tables

Chairs

Profit

0

4

$40

1

3

$46

2

2

$52

3

0

$48

I solve this problem graphically showing the 4 corner points and the optimal solution.

I introduce shadow prices by offering the students an additional large block and ask how much they are willing to pay for it (answer = $6). I show a second large block and ask how much the students are willing to pay for it (answer = $6). Finally, I show the students a third large block and ask how much they will pay for it (answer = $0).  I lead a discussion on the concept of shadow prices and finally wrap up with solving the Legos problem on Excel.

I find that playing with Legos in class lightens the mood and makes LP more understandable.

Guest Post: Total Cost of Ownership

john bowlerOur Guest Post today comes  from John Bowler, who is Visiting Professor at DeVry University’ s College of Business.

As the Heizer/Render OM text suggests in Chapter 11, the collaborative relationship between buyer and supplier should yield the lowest total cost of ownership (TCO). TCO is the sum of all direct, indirect, and opportunity costs over the life cycle of a purchase. The goal of the TCO approach is to obtain the most economical total price and not necessarily the lowest initial price. This is the focus of many successful collaborative supplier-client relationships.

The elements of TCO are (but not limited to): Item price; Item ordering cost; Transportation costs; Receiving costs; Inventory carrying cost; Shortage cost; Warranty cost; and Aftermarket/preventative maintenance cost.

TCO composition varies by the type of product, the product’s life-cycle stage, supplier’s location, the buyer’s production methodology and/or method of service delivery. Determining the TCO can be a challenging task. One way to start is to identify the supplier’s costs (or contributions) in regard to the following:

  • Integration relates to how well the supplier meshes with the buyer’s established infrastructure and processes to include the ease by which information flows both ways between buyer and the supplier. In today’s supply chain, timely and accessible information flow is very much as important as on time, in spec, delivery of the product or service.
  • Collaboration relates to the ease of doing business with the supplier.
  • Synchronization refers to supply chain capabilities such as the flexibility to drop ship direct to the end user.
  • Leverage focuses relates to the competitive advantage a supplier contributes to the client’s competitive capabilities.
  • Acceptable risk relates to the level of the supplier’s reliability and resiliency in supporting the buyer’s ability to maximize chosen profit opportunities.

TCO data-driven conclusions provide a competitive advantage to firms across various industries. Thinking outside the box of ways to maximize profitability in supplier relationships rather than calculating ways to minimize supplier costs will earmark industry leaders in the future.

Guest Post: A Class Exercise Relating Productivity and the Olympics

HowardWeiss2Howard Weiss is Professor of Operations Management at Temple University. He has developed both POM for Windows and Excel OM for our text
When I teach productivity, I like to explain to the students that while output/input seems simple, it can be difficult to assess.  The Heizer/Render textbook includes multifactor productivity (Chapter 1) where the multiple factors are all inputs, and I like to ask my students to take it a step further.

There are many web sites that list the Olympic medal count for any Olympics. I show my students the top medal-winning countries from one of the more recent Olympics, such as those listed at http://en.wikipedia.org/wiki/2012_Summer_Olympics_medal_table.

When I am in the classroom I ask my students, “What information would you want in order to answer the question, “Which of the 5 countries shown below was the most productive in the 2012 Olympics?” This raises many interesting issues. Students will discuss the different inputs that might be used such as population, dollars spent training the Olympians and number of athletes competing. Some students will note that different outputs can be used. For example, outputs could be total medals or a weighted average of gold, silver and bronze medals. For the 2012 Olympics, I point out that based on the sorting in Wikipedia, it is using only gold measures, as its output measure as can be seen when comparing Great Britain and Russia or South Korea and Germany.

I also ask the students to find websites that list the countries in a manner that we would call productivity. This web site has a graph of the top 8 countries based on medals per athlete while this one includes the inverse of productivity in its table on athletes per medal.

The students generally find this to be a fun exercise and appreciate that inputs and outputs may not be as simple as one might think. In the course of searching for Olympic productivity on web sites, they also find sites that are interesting even though the site does not answer the productivity question. One example is this site, which explains that American workers are less productive during the Olympics. Finally, the exercise was very timely this past week since the Olympics are currently going on.

Guest Post: Using Excel OM on a Tablet

HowardWeiss2Howard Weiss is Professor of Operations Management at Temple University. He has developed both POM for Windows and Excel OM for our text.

It is now very easy to run Excel OM on an iPad or Nexus. This is not due to changes in Excel OM but rather due to a free app that is available for tablets. The app is OnLive Desktop and can be found at the iTunes App Store or the Google Play Store. The app runs Windows 7 on your tablet and includes Microsoft Office 2010. Unfortunately, the internet is not available with the free version.  OnLive interfaces with your files through an account on the OnLive cloud.

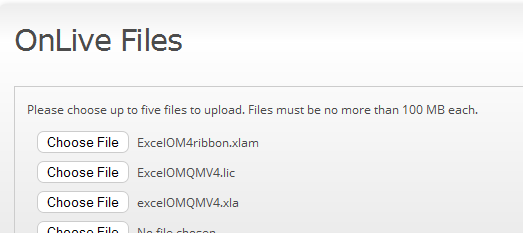
To setup OnLive you simply need to : (1) Install OnLive Desktop on your tablet; (2) Create a free account at desktop.onlive.com; and (3) Upload ExcelOM (3 files) to your OnLive cloud account as shown below.

Excel OM1

To run Excel OM on your tablet you: (1) Open OnLive Desktop on your tablet and sign in; (2) Open Excel; and (3) Go to File and Open ExcelOMQMv4.xla

You can save your Excel OM problem files to your account at OnLive desktop and then access them from your computer.

Please note the following:

  • OnLive desktop’s Excel does not include Excel’s Solver so you cannot run linear programs, transportation models or the project management crashing model.
  • Some of Excel OM’s tools, such as visiting the Pearson web site are not available since the internet is not available.
  • Your current version and build of Excel OM will work but Excel OM has been updated to better interface with OnLive so you should download the latest build from the Excel OM support page at prenhall.com/weiss.

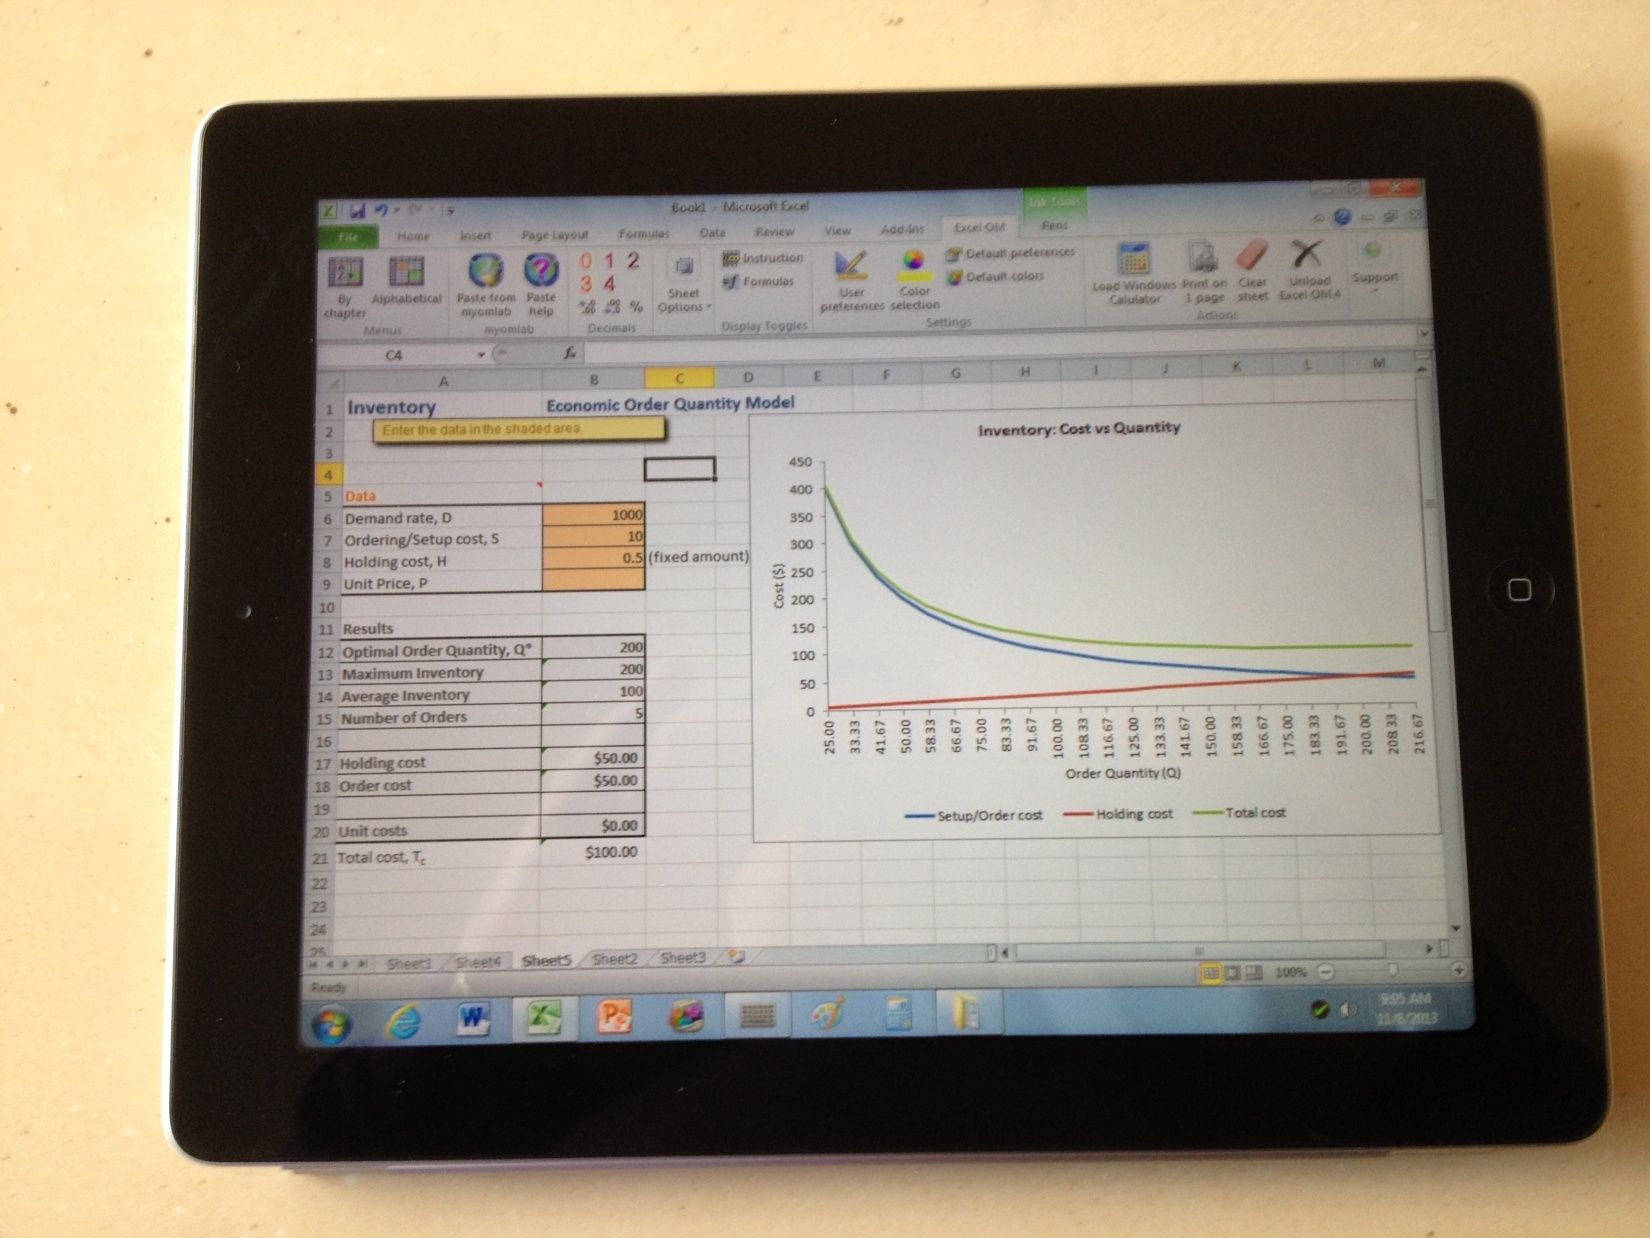
Below is a picture of Inventory Example 3 from Heizer/Render OM 11e, using Excel OM on an iPad

excelom2

Guest Post: Custom Teaching Evaluations at Temple University

Howard WeissOur Guest Post today comes from Prof. Howard Weiss. Howard has developed both POM for Windows and Excel OM, which we provide free with our OM texts.

At Temple U., as at most colleges, we have long distributed course evaluations to students at the end of the semester. These evaluations include general questions about the quality of the instructor, the value of the course, the workload in the course and include opportunities for students to provide general comments. There are two glaring difficulties with these evaluations. Possibly due to Temple’s size, the results are not presented back to the faculty members until after the start of the spring semester. This makes it difficult to make adjustments in time for the spring semester based on fall results. More recently, a new difficulty has arisen. The university evaluations are performed on the web, and the response rate has dropped greatly.

For some time now, I have been giving my students my own evaluation, with questions that are much more specific than those on the university forms. I ask them about the course requirements and the weights that they think should be assigned to each requirement. I ask about the use of Excel in the classroom. I allow my students to use either POM for Windows, Excel OM, or both for homework and exams, and I ask them if I should continue to do so or require only one of the 2 packages. I ask about the value of preparing their presentations for my class, the value of actually presenting and the value of listening to classmates’ presentations.

Of course, I also ask about the use of MyOMLab in the class. Once again this fall, the students have overwhelmingly endorsed MyOMLab.  100% of students who responded to my survey agreed that MyOMLab should continue to be used for homework and quizzes. And 84%  wrote that I should continue to use MyOMLab for the exams. These results are very consistent with surveys from previous years.

I like having my own survey with specific feedback and receiving the feedback in time to prepare for the next semester. Do you agree?

Guest Post: The 3 Platforms Fuelling Growth in Supply Chain Finance

oliver belin 2Our Guest Post today comes from Oliver Belin, an executive with PrimeRevenue (http://www.primerevenue.com/blog/), who is coauthor of the book Supply Chain Finance Solutions (Springer Verlag, 2011).

The current, global market size for Supply Chain Finance is estimated at $275 billion of annual traded volume. It is still relatively small compared to the market size of other invoice finance solutions such as factoring, which remains the largest trade finance segment and is primarily domestic in focus. There are about 200 global Supply Chain Finance programs of scale in place. These programs are run both domestically and cross-border and in multiple currencies. Still, the market potential is far from its capacity. If examining spending of large organizations, such as Lowe’ s $33 billion, it becomes apparent that Supply Chain Finance programs usually require a multi-bank platform due to the credit and capital issues associated with banks.

Supply Chain Finance practices have been in place for over a decade and 3 distinctive platforms have crystallised.

In buyer managed platforms the buying organization owns and runs the platform. Some large retailers, such as Carrefour, are using such solutions and managing the finance program, supplier onboarding, and liquidity themselves.

In bank proprietary platforms the IT solution is managed by commercial banks providing the technology platform, services and funding. This solution is used by several large buying organizations such as Carlsberg and Marks & Spencer.

The platform that has exhibited the strongest growth is represented by independent third-party supply chain finance providers offering multi-bank platforms. This solution separates the entities, a specialized service provider which manages the platform, and the funding partner, which provides liquidity and takes the credit risk. Based on the fact that funding in Supply Chain Finance is uncommitted and due to the general limitations in terms of credit risk appetite, companies such as Volvo, Lowe’s, KPN and other leading organizations have chosen this structure.

Guest Post: Celebrating 25 Years of POM Software

Howard WeissOur Guest Post today comes from Prof. Howard Weiss, at Temple University. Howard writes about his 25 years of developing POM for Windows, which we provide free with our OM texts.

This month marks the 25th anniversary of Pearson’s POM software package.  Just as technology has evolved over the past 25 years, so too, has this educational resource.  The initial package, PC-POM, indicated that POM was designed for DOS and would not run on a Mac computer.  Today, POM will work well on a Mac using vmWare or Parallels to emulate Windows.

Jay and Barry decided that PC:POM would be a valuable addition to their text and it became available as AB:POM, where AB stood for our publisher at that time, Allyn & Bacon.  The POM software has been distributed with every edition of Heizer/Render since its inception. (By the way, OR/MS Today (page 10) just interviewed Jay and Barry about their 30+ years of writing).

POMIn 1996, with the rising popularity of Windows, POM was redeveloped for Windows.  While the solution techniques remained the same, it was a monumental challenge to change the graphical user interface to match the look and feel of Windows.   Cutting and pasting between POM and other Windows programs such as Excel and Word were built into POM.  For preparing the manual, scissors and paste were no longer necessary, because screen captures could be copied from POM and pasted into Word.  In addition an option to save problems as Excel files was built into POM in which the models are saved as complete Excel models with appropriate formulas and/or graphs.

An exciting recent addition (in Version 4) is the capability to copy from MyOMLab and paste into POM.

Developing the software has been a rewarding venture and it has been very gratifying to hear from students around the world who have used the program.  I hope that if you use POM,  you and your students have had the same positive experiences. I encourage those of you who have not used it to give it a try in your classroom.

Guest Post: Learning from Bangladesh – The Socially Responsible Supply Chain

andreas_wielandrobert hanfieldToday’s Guest Post today comes from 2 researchers in the SCM field, Andreas Wieland (left) at Berlin Technical U. and Robert Handfield at N. Carolina State U. 

Two recent disasters in the garment industry, the Tazreen Fashions fire and the Rana Plaza building collapse, have caused outrage over the lack of social responsibility across global supply chains. As we discuss in our new article in Supply Chain Management Review, “The Socially Responsible Supply Chain: An Imperative for Global Corporations,” integrating social responsibility into a supply chain strategy is not easy. Because of the emphasis on cost efficiency and supply assurance as the basis for supply chain strategy, other targets like focusing on social aspects have often been ignored. This is made even more challenging by the fact that customers are often unwilling to pay more for socially responsible products. Using this rubric, sourcing from regions with the lowest possible labor costs has been the most important criterion for Western retailers when selecting suppliers. Social responsibility not only competes with cost efficiency, but also with other targets such as customer requirements and flexibility.

There are three core principles that are essential for ensuring socially responsible business practices and successfully managing the extended global supply chain. First, a program to audit both products and suppliers (beyond tier-1 suppliers) needs to be implemented. Second, visibility (perhaps using smart technologies) is important for those categories of supply that cannot be directly controlled. Finally, collaboration is needed to successfully managing a socially responsible supply chain; this includes collaboration across the industry–and with local partners.

An excellent example of these principles in action is an approach adopted by the Swiss clothing manufacturer, Switcher. Each garment bears its individual Respect Code, a number sewn into each product, along with the Code’s web address. This code can be used by the customer to find online information about the product’s supply chain, including social and ecological information of each plant. Using the code, consumers may learn that production of a certain jacket took place in Portugal, that the plant is ISO 14001 certified, and that the CO2 footprint is 7.6 kg. Consumers can also see when the plant was last audited.

It is time to become serious about socially responsible supply chain management.

Guest Post: Different Approaches for Engaging Students in a Study Abroad Class Setting

flammOur Guest Post comes from Phillip Flamm, who teaches OM in the ISQS Department at Texas Tech University.

Students in the Texas Tech University Study Abroad program face a few difficult challenges in their Operations Management course every summer. In addition to enduring a 3 hour class period daily, they must stay focused on course work despite the following distractions: (1) Adjusting to different food, culture, etc.; (2) The attractive “night life”; and (3) Side trips 3 times a week that include lots of walking. In short, students who don’t maintain their focus will be dragging to class and struggling to stay awake. This setting is a recipe for disaster for the average 20-year-old.

In a previous Guest Post, I described one potential answer to this challenge: Total Team Collaborative Learning. The course guidelines:

  • Teams of 3,
  • Following each lecture, students review lecture notes to make sure all team members understand the material,
  • In addition, the teams go over all lecture material from each prior lecture. This means that they will go over specific lecture material several times prior to the exam,
  • Team members have a peer review grade,
  • Each team will prepare a short lecture on a particular quantitative method and “teach” the class this method,
  • Teams will take a quiz daily (as a team) from the previous day’s material,
  • All exams are taken as a team (these exams are the same as what I give during the regular semester where average grades are 63 to 65….the lowest team grade was 88/100).

Based a survey given at the end of the course this past summer, students indicated that they retained more in a shorter period of time and understood the material. In short, they loved the Total Team Collaborative environment and sharpened their team building skills in preparation for the time when they will be asked to work on a team with their new employer.

Guest Post: Supply Chain Risk Management and ISO

Chris Bowler
Chris Bowler
John Bowler
John Bowler

Our Guest Post today comes  from John Bowler, who is Visiting Professor at DeVry University’ s College of Business, and Chris Bowler, who is Principal, Porter Keadle Moore, where he specializes in Enterprise Risk Management.

We find it interesting that the foundation of the relatively new Supply Chain Risk Management (SCRM) ISO standard is based on theories first advanced quite some time ago – PDCA (Deming, circa 1950) and Competitive Strategy and Competitive Advantage  (Porter, circa 1980 and 1985).  Along the same lines, Jay and Barry’s OM text states in Chapter 2 that competitive advantage is achieved through one of these three strategies: (1) differentiation, (2) cost-leadership or (3) response. We note that the Accenture 2011 Global Risk Management Study found 47% of the companies surveyed listed “reducing costs” as their highest risk management challenge.

While many firms today are focused on “lean” cost reducing practices, some companies and many experts are finding that these lean approaches can create unanticipated events, which can quickly escalate into crisis and perhaps even system failures. Is it reasonable then to suggest that a company  is better served by refocusing its SCRM efforts on its specific competitive strategy’s strengths, weaknesses, opportunities, and threats?  Along those lines, ISO 28002 (2011) brings these following new insights to the table:

  • SCRM is really about effectively capturing profitable business opportunities compatible with a firm’s (competitive) strategy.
  • SCRM effectiveness depends on the resiliency of the firm’s processes, people and technology to both stress and breaks along the supply chain.
  • When an organization incorporates and aligns its SCRM with its strategic goals, the resultant degree of resiliency ensures the firm’s long-term profitability and survivability.

This new way of thinking about SCRM as Supply CHANGE Management reflects transformational thinking not only for finance and operations but for the C-suite as well.

Guest Post: A First Day of Class OM Exercise

steve harrodDr. Steven Harrod is Assistant Professor of Operations Management at the University of Dayton. Today, he shares a tip on teaching critical thinking.

For many students, OM is an intimidating field of study–the first course that blends mathematical methods with qualitative decisions. For example, queuing theory is clearly mathematical, but choosing which queue structure is often a subjective decision. Today’s hot topics of “big data” and analytics require problem formulation skills, so I begin the OM course with an exercise to promote critical thinking. In particular, I seek to train my students to formulate decision questions in quantitative terms. I pose the question repeatedly, “What are the measurements?”

I motivate this discussion with a news story on health care, specifically, whether a surgically inserted stent or drug therapy is a better choice for patient care. First, I introduce the topic and instruct the students to think carefully about the news story. I ask them: Who are the stakeholders? Who are the decision makers? What are the objectives? What are the measurements?  And finally: What defines success? I then play the news story audio (which is found here).

Almost invariably, initial student answers will be vague, such as “improve the quality of health care” or “provide high quality care.” But drill the students to focus on tangible measures. Ask: “How do I measure that?” After some dialogue, you should reach agreement on more precise measures such as life expectancy, death in surgery, cost of treatment, cost of drug, duration of treatment, etc.

The news story presents this question as an argument between a Dr. Teirstein and a Dr. Topol, but after working through these discussion questions, you will find the real conflict between these doctors is over the choice of objectives and measures. Dr. Topol’s primary objective is lower cost, but Dr. Teirstein’s is fast treatment. This discussion is in fact a prelude to future topics in the course. In so many areas of OM, cost and speed are fundamental tradeoffs. No where is this more evident than in the study of queuing theory (Module D). Thus the debate over healthcare is at its root a debate over the balance between fundamentally opposed performance measures.

A detailed teaching note for this lesson is available here.

Guest Post: Are You Flipping?

Wende BrownDr. Wende Huehn-Brown is Professor of Business at St. Petersburg College.

In my prior guest blog, I shared a pencast I created to help students learn the analytical methods for a productivity problem.  I have been teaching operations management for over six years and during this time period have created 31 pencasts on various problems from the Heizer/Render OM textbook. I have also made 27 screen-captured videos using the decision science software (by Temple U. Professor Howard Weiss) that accompanies the text for free.

Some might ask why?  Yes, the textbook has numerous examples to help support students to learn the analytical methods. And MyOMlab also has good learning aids available for help in solving problems.  But it seems my students need more visual methods, with further explanation, to complete their homework assignments successfully.

The majority of my classes at St. Petersburg College are online.  Additionally I teach a blended section, and with this advancement of technology I am better able to do other active learning exercises or simulations during this meeting time.  There are a number of sources for ideas to structure activities for this meeting time available in OM.  For example, I have used a few articles from the Decision Science Journal of Innovative Education.  In this manner, I am able to run my blended class more as a “flipped” or “inverted” classroom.  Thus I use these resources for all classes to help students learn the analytics on study plan problems. I then assign other problems without these added resources for homework and later exams.  On the average, students in the blended class–with this flipped or inverted learning modality– score almost a whole letter grade better than the entirely online class where students elect not to come to this meeting time.

Can any readers share their approaches to help students learn better?

Guest Post: Trends and Strategies in Logistics and Supply Chain Management

Dr. A. Wieland
Dr. A. Wieland
Dr. R. Handfield
Dr. R. Handfield

Our Guest Post today comes from Andreas Wieland (http://scmresearch.org/)  and Robert Handfield (http://scm.ncsu.edu/blog/). Andreas heads the Kühne Foundation Center for International Logistics Networks at the TU Berlin. Rob is director of the Supply Chain Resource Cooperative at North Carolina State University.

Some months ago, BVL International engaged us to find the most important trends that are currently going on in logistics and supply chain management and also the most powerful strategies to cope with these trends.

Our general observation, derived from both over 60 interviews and the analysis of over 1,700 international survey responses, is that complexity in the form of consumer demands for customized solutions, increased product variations, and fragmented channels has increased. We found that high customer expectations, an increasingly networked economy, intense cost pressure, as well as ongoing globalization, shortage of talents, and pronounced volatility are dominating trends in logistics and supply chain management. Other important trends are sustainability, risks and disruptions, and new technologies.

How should organizations prepare themselves to deal with these emerging trends? The top performing companies are not only preparing themselves for these trends; they are even seeking to exploit them for advantage. First, people are the core of any organization, and strategies to find and keep talented logistics managers and warehouse/transportation workers are crucial. Second, a strong core set of processes is needed, and these processes should be adaptive and flexible to accommodate different local and regulatory conditions. Third, technology must be leveraged to provide insights, visibility, and promote an action-oriented culture. Fourth, end-to-end integration will become an increasingly important logistics and supply chain strategy in the next five years. Finally, to pursue ethical, social and ecological standards, organizations will increasingly need to work both vertically and horizontally with suppliers, service providers, local agencies, and governments.

Our report, coauthored by Drs. Frank Straube and Hans-Christian Pfohl,  “Trends and Strategies in Logistics and Supply Chain Management,”  is available on BVL’s website.