OM in the News: Jumping the Queue at Universal Studios

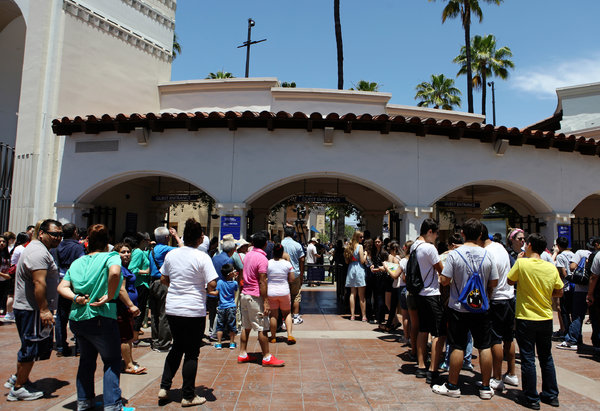
Universal StudiosSince I live in Orlando, the theme park capital of the world, the recent New York Times article (June 10, 2013) “At Theme Parks, A VIP Ticket to Ride”, caught my eye. Theme parks have traditionally been the ultimate melting pots. Tourists, retirees, rowdy teenagers, families and fathers who would rather be golfing are all thrown together in an egalitarian experience in which the queue for one is the queue for all, and cotton candy is the food of the masses. Not anymore.

As stratification becomes more pronounced in all corners of America, from air travel to Broadway shows to health care, theme parks in recent years have been adopting a similarly tiered model, with special access and perks for those willing to pay. Now Universal Studios has pushed the practice to a new level. It has introduced a $299 V.I.P. ticket (the regular admission is about $85), just in time for the summer high season, that comes with valet parking, breakfast in a luxury lounge, special access to Universal’s back lot, unlimited line-skipping and a fancy lunch.

Fearful of puncturing its utopian image, Disney has stuck to a single class of ticket. V.I.P. tour guides are available, but Disney charges an exorbitant price — $380 an hour, with a minimum of six hours — to limit demand. Business is good at both companies. Universal’s 3 theme parks in the U.S. attracted 20 million people last year, a 19% increase from 2010. The Magic Kingdom at Walt Disney World recently recorded the busiest day in its 41-year history.

The amusement park industry urgently wants to expand profits without introducing costly new rides every summer. Universal, which recorded $953 million in profit from its parks in 2012, has no major new attractions planned until next year; the V.I.P. Experience, in the meantime, is a relatively low-cost way to generate revenue and send a message of bigger and better into the marketplace.

Discussion questions:

1. What are the ethical implications in the new VIP system?

2. Explain how Universal’s model relates to Figure D.5, “The Trade-off Between Waiting Costs and Service Costs”.

Guest Post: A Teaching Tip for Visualizing Waiting Line Flows and Interarrival Times

steve harrodWhile Jay and Barry attend the INFORMS meeting in San Antonio, Dr. Steven Harrod, Assistant Professor of Operations Management at the University of Dayton provides this, his 5th Guest Post for our blog.

I find in teaching Waiting Line Models in Module D of the Heizer/Render text that the definitions and relationship of rates of flow and inter-arrival times are frustratingly difficult for some students to grasp. Here is a classroom exercise that may help:

Introduce the following video (http://youtu.be/O84FlZnP0qs ), explaining that it shows traffic starting after a red light turns to green. Start the video at 0:17 (prepare the video in advance so you don’t have to watch the commercial during lecture). Draw the students’ attention to the second lane of traffic, headed by the Range Rover.

Explain that this flow of traffic may be described either by how many cars cross the white stop line in a period of time, or by how long each car takes to cross the line. Either way, the traffic flow described is identical. Play the video, and count ten cars across the line (ignore the car that changes lanes). Car number ten is a yellow cab, so stop the video with the eleventh car at the white line. You should find the video counter at 0:42, or 25 elapsed seconds. This is a flow of 10 cars in 25 seconds, or 10/25 cars per second, or 1440 cars per hour.

Restart the video at 0:17. Now, count the seconds between each successive car at the white line. They are, approximately, 5, 3, 2, 1, 3, 2, 2, 3, 2, and 2. The average time between cars is then 2.5 seconds. Now, since in both cases we have witnessed the same traffic flow, make the argument that these two measurements are equivalent. Indeed they are, after you explain that the inter-arrival time of a flow and the rate of flow are inverses of each other. In this case in particular, (1/2.5) = (10/25) and [1/(10/25)] = 2.5.

For some students, this is a difficult concept, and I  repeat this approach multiple times in the course.

OM in the News: Eliminating the Waiting Line at Hotel Check-In

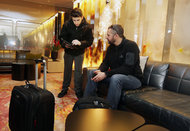
Concierge registering guest at Andaz West Hollywood

Hotels are changing the way guests check in to their rooms, writes The New York Times ( March 19, 2013), eliminating the traditional stop at the front desk to speed up, simplify and personalize the process. When guests arrive at citizenM, a boutique European hotel chain, they check in at a kiosk and go straight up to their rooms. The kiosk was designed to be easy to use because most travelers are encountering it for the first time.

“The hospitality industry is moving toward more automated check-in systems,” says NCR’s VP for kiosk systems. “Customers are used to A.T.M.’s at the bank instead of tellers, checking in for airplane flights online, and they are now looking for that same efficiency when they arrive at a hotel. No one wants to wait in line for the front desk anymore”.

Automated hotel check-in is expected to expand rapidly. In a typical system, guests check in by computer or phone before they arrive and enter their expected arrival time, which helps the housekeeping staff with the room cleaning schedule. A bar code is sent to the traveler to print out or display on his or her phone. At the hotel, the guest scans the bar code at a kiosk. The machine assigns a room and spits out the number of plastic key cards requested, and the guest can head upstairs.

Hotels are also using new technologies to eliminate the front desk check-in line — with personal greeters who shepherd guests through the check-in process in a more comfortable setting. Andaz West Hollywood has combined its front desk staff, bellmen and concierge functions into “hosts,” who greet guests as they enter the lobby and sit with them on comfortable couches to check in using an iPad with a credit card reader.

This article is a nice complement to the Winter Park Hotel case study in Module D.

Discussion questions:

1. What is the benefit to hotels in implementing kiosk check-in?

2. Will these systems be widespread in a few years?

Guest Post: Teaching Inter-Arrival Times in Queuing Models

steve harrodDr. Steven Harrod is Assistant Professor of Operations Management at the University of Dayton and can be reached at steven.harrod@udayton.edu. Here is a link to his syllabus.

The single greatest challenge in teaching queuing in Module D of the Heizer/Render text is getting students to comprehend the difference between inter arrival and rate of flow. There is something deeply psychological and subconscious about this. Students frequently skim over the text and do not distinguish between the two expressions. Here is an in class exercise to practice this concept:
For each scenario in the table below, ask students to calculate the inter-arrival time and the flow rate (with answers shown in the right columns). Clearly state the unit of time measure for each answer. Each description refers to a random flow.

Inter-Arrival=time/(arrival count)       Flow, λ=(arrival count)/time=1/inter-arrivalSrteve Harrod mod. D graphic

Description

Inter-Arrival

λ

The ticket taker at the roller coaster   collected 45 tickets in 3 hours.

4 m

15/h

Cars arrive at the car wash once every 3   minutes.

3 m

20/h

Customers arrive at McDonald’s at the rate of   100 per hour.

0.6 m

100/h

Customers were recorded entering the store at   12:05, 12:07, 12:15, 12:22; 12:30: 12:31, 12:33, 12:40, and 12:50.

5 m

12/h

Fifteen passengers arrived for the 1 pm bus,   then twenty-five passengers arrived for the 2 pm bus, and then ten passengers   arrived for the 3 pm bus.

3.6 m

16.66    /h

Good OM Reading: Analytics at Disney World

Here in the tourist mecca of Orlando, Disney World reigns as king. With 60,000 employees (called “cast members”), Disney is a driving force not just in our economy, but in the use of operations management tools. Analytics (Sept.-Oct. 2012) has a great piece on the careful planning guests don’t see taking place “behind the scenes” to run the operation smoothly. The article examines the role analytics plays in ensuring the guest experience is maximized. It makes a nice supplement to our text coverage of Disney in both the forecasting (Ch.4) and waiting line (Module D) chapters.

The authors write: “Forecasting serves as the analytical foundation for operations planning at the Resort. It all starts with the park attendance forecast, which lays out the expected attendance at each park. These predictions are strongly considered when setting park hours and performing other strategic planning. More granular forecasts are required for each individual area, such as guest arrivals at the hotel front desks. The company recently launched a new labor demand planning system, which generates forecasts for every 15-minute period at many locations throughout the property, including park entry turnstiles, quick-service restaurants and merchandise locations. These forecasts help the resort plan labor effectively to ensure guest service standards are met”.

Another innovative way the resort uses forecasting is for attraction wait times. The most popular attractions use Disney’s FASTPASS system – a unique virtual queueing system that allows guests to receive a ticket with a designated 1-hour window of time when they can return and skip the regular line. From a central command center underneath the Magic Kingdom, forecasting models are executed every 5-10 minutes to project the return patterns of FASTPASS guests based on entertainment schedules and the number of FASTPASS tickets that have been distributed. The forecasts are posted at the front of the attractions to help guests choose whether to enter the line, take a FASTPASS ticket or return to the attraction later in the day. These wait times are also available on Disney’s Mobile Magic smart phone app, which shares real-time information about the parks throughout the day.

I think your students may also enjoy reading this down-to-earth article.

OM in the News: The $1,000,000,000 Queue

The newspaper in your town probably doesn’t run its lead story about queues and wait times. But this is Orlando, and when Disney World (with its 62,000 local employees) announces a $1 billion program to improve wait times with “interactive queues”, it is the headline (Orlando Sentinel, March 26,2011)!  Queues alone consume 10-20% of Disney’s capital budget.

Queues are a delicate balance at all of Disney’s theme parks, especially at Magic Kingdom, which hosts more than 45,000 visitors daily. Guests paying $85 to get in have long complained about the lines as their #1 beef. “Where are you going to put all those bodies? Well, some of them have to be in a queue”, says a UCF prof.

Here are some of the ways Disney’s “Next Generation Experience” project is spending its massive budget: interactive queues at Space Mountain, Winnie the Pooh, Haunted Mansion, and Epcot’s Soarin’. After 40 years of slowly shuffling towards the Haunted Mansion, for example, waiting riders now move through a graveyard filled with elaborate crypts. When you touch the tomb of a composer, instruments carved in the stone play music.

Disney has always paid attention to ride queues, with lavishly themed “pre-shows” that help establish the attraction’s story line.  Disney added giant video screens in the Soarin’ queue, equipped with sensors that allows big groups of guests to play collaborative games while waiting. Now it has placed 87 video-game stations in the Space Mountain queue and play areas for kids in the Winnie the Pooh line.

“Guests were willing to wait 12% longer because of the interactive experience”, says a Disney exec. That’s about 7 min. in an hour-long line. (To read our 2 earlier blogs about Disney and queues, click here).

Discussion questions:

1. Disney’s “NextGen” will also let guests book ride times from home and by-pass lines entirely. Is this a good OM idea?

2. Why is Disney willing to spend $1 billion to make its lines more fun?

OM in the News: Queuing Up For Quick McDonald’s Medicine

McDonald’s medicine it’s called: patients in the US want their health care like their food–served up speedily and made “your way”. ” The prospect of waiting for health care is not only distasteful to Americans;  its downright threatening”, say the  MD authors of the recent Time (Jan. 26,2011) article. The mere specter of Canadian-style waiting  lists for tests and procedures evokes enough fear to challenge the concept of government subsidized health care, they add.

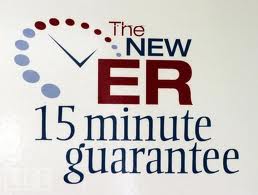
We have blogged about waiting for medical care earlier and it’s clear that convenience has become an important part of the way people think. CVS  drug stores offer walk-in “Minute Clinics”, many ERs have billboards advertising guaranteed wait times (offering free movie tickets if they run longer), while other hospitals have even experimented with drive-thru ERs!

The real question is whether it is feasible to implement a reasonable waiting time for “urgent” conditions—like heart attacks, strokes, and lung infections. The good news is that convenient care clinics do a good job of handling coughs, colds, a swollen knee, and even a nagging hernia that hurts a bit more than usual today. But the root problem may be that the current system of medical care  is not set up to triage acute health needs.

This is where OM can help. So many of the issues tied to creating more efficient heath care can be tackled by re-engineering, process analysis, layout changes, JIT, lean,and all the other topics we teach in OM. You can click on Mark Graban’s Lean Blog to see his excellent discussions.

Discussion questions:

1. Why do we need to reorganize ER treatment centers?

2. What is the difference between “severity” and “urgency” in selecting a treatment?

3. How can OM help shorten ER queues?

OM in the News: Disney and the Art of Queuing

On Thanksgiving, I  blogged  that our family spent a day (mostly in queues) at Disney World, here in Orlando. My report was from the perspective of a customer being entertained while in lines and touring the park.

Now the New York Times (Dec.28, 2010) presents the inside view of the same theme park, but from the underground control room. This nerve center sits below the Cinderella Castle and has made the art of queuing into a science.

“There has been a cultural shift towards impatience–fed by video games and smart phones”, says a park manager. Customers are simply demanding more action. One response:  at Space Mountain, 87 game stations now line the queue to keep visitors entertained. Each provides 90 seconds of  game challenges.

The operations center monitors all 40 rides at Magic Kingdom, and because of its efforts, the average park visitor can now ride 10 of them (up from 9) in a typical day. For example, if a control center light monitoring the Pirates of the Caribbean ride changes from green to yellow, the operations manager can launch more boats…. or may dispatch Capt. John Sparrow or Goofy to entertain people in line. If Fantasyland  is swamped, but Tomorrowland less crowded, the ops center can relocate a miniparade to siphon guests in that direction.

Discussion questions:

1. Why does Disney expend such effort on queue management?

2. What other approaches could be attempted to shorten waits?