OM in the News: Fighting Pandemic Stockouts

Plenty of retailers and supply chains are still suffering from stockouts. From cleaning products, to kettlebells, to appliances, to meat, retailers, manufacturers and suppliers are coming up short. Forecasts need fixing in a period of severe economic upheaval such as a pandemic–and this article in Supply Chain Dive (Sept. 8, 2020), has 4 ideas for making the changes.

  1. Supply chain managers should plan more often. Companies normally planning on a monthly cycle should switch to every 2 weeks; those on a 2-week cycle should shift to weekly. As demands related to coronavirus mash up with those of the upcoming holiday season, it is critical to have more data points and more sophisticated methods around demand planning to account for some of that volatility and surprises.
  2.  Focus on core products and customers. Companies can learn from how home improvement retailers operate during natural disasters. Instead of trying to keep everything in stock, they focus on the most in-demand items. Several large brands and retailers have employed the core product tactic during the pandemic, cutting back SKUs and, in some cases, entire product lines.
  3. Shift more manufacturing to the U.S.  A domestic U.S. industrial company with 2-3 factories with 4-5 distribution centers has a lot more ability to flex up and add shifts, even with the new social distancing and safety measures that are required because of COVID.
  4. Give something new a shot. If items are in short supply, and not coming back on board anytime soon, companies can  try a new brand or a new product — maybe one they have considered bringing in. Those items may be easier to get, and customers are more likely to be receptive to having an alternative option rather than nothing at all.

Classroom discussion questions:

  1. Which of these would be most critical to a sports equipment manufacturer today?
  2. How must forecast methods change?

OM in the News: A Forecasting Nightmare for Farmers

In early July, S. Carolina farmer Jeremy Storey dropped off an order of eggs at a restaurant’s back door as planned and continued on his way. But 6 hours later, he got a call  that the eggs were never collected — the restaurant had suddenly closed because a staff member tested positive for Covid-19, and nobody canceled the order. After half a day in the hot sun, the eggs could no longer be eaten.  “Half the restaurants we’re going to now, we find out upon delivering to them that they’re closed,” he said. He’s now sitting on a surplus of about 24,000 eggs, with no idea when, or if, things will stabilize.

The unpredictability is a major problem for farmers. If they can’t forecast what demand for eggs (and other products) will look like tomorrow, much less months out, they run the risk of overproducing — which would leave them with expensive surpluses — or underproducing, which would prevent them from having enough product on hand to meet demand.
Now, just as restaurants began to resume dine-in service, a new surge of coronavirus cases has paused reopening plans and put farmers back in limbo — and made it even more difficult to forecast. Planning is essential to farmers because they have to anticipate their customers’ demand months, and sometimes years, ahead of when they deliver so that they have enough time to grow crops or raise animals, writes CNN Business (July 16,2020).
Uncertainty “is really what’s causing the problem,” said a union exec. “There’s no end in sight. That makes it “really hard to plan for the future.” If the uncertainty drags out for another year or two, he said, some farms and restaurants will go out of business. It also means that some restaurants that make it through this dark period won’t have a steady source of supply at the other end.
Classroom discussion questions:
1   Should demand during the pandemic be excluded from future time-series forecasts?
2.  With so much uncertainty, is it better to raise or lower production for the next agricultural cycle?

OM in the News: The Company That Makes 11-Month Forecasts

Sorry about that White Christmas, Philadelphia. It’s not looking good; temperatures are going to be at least in the 40s. Looking further ahead and afield: Come March, warm weather will boost shorts sales 28% in Chicago over last year, but the shorts business will be off a cool 15% in Tokyo. Oh, and good news for travelers: Flight delays at Philadelphia International Airport will be down 42% next year, compared with 2019, thanks to considerably less precipitation.

That is all according to  Weather Trends International, a Pennsylvania-based company that sells long-range — as in 11 months in advance — forecasts to retailers and investors, writes The Philadelphia Inquirer (Dec. 9, 2019). Home Depot, Target and Walmart,  JP Morgan, and Coca-Cola have all been customers. Reliable year-ahead forecasts would be invaluable to retailers. “Once merchandise has been put out for the season,” said an exec, “the cake is baked.” (Once a customer purchases an 11-month outlook, by the way, the company doesn’t change or update them).

Weather Trend’s formula is about two-thirds statistical analysis and the rest an analytical blend that includes weather “cycles,” primarily slow-occurring shifts in ocean temperatures and air pressure patterns, including the El Niño/Southern Oscillation and the Pacific Decadal Oscillation–plus 417 trillion bits of data. Temperature forecasts can be calibrated to retail sales: A one-degree difference makes a 15% change in air-conditioner sales and a 7% difference in the sunscreen business. A study by two climatologists concluded that for temperatures, the Weather Trends’ year-a-head forecast outperformed the U.S. Climate Prediction Center’s 3 month forecasts, which are updated monthly, four out of five times.

This is an interesting variation from the 3 types of forecasts (i.e., economic, technological, and demand) that we discuss in Chapter 4.

Classroom discussion questions:
1. Referring to “Forecasting Time Horizons” in your Heizer/Render/Munson text, how do short term forecasts differ from longer ones?

2.  Why is a weather forecast an OM tool?


OM in the News: Popeyes Runs Out of Chicken?

The new chicken sandwich

Popeyes sparked the so-called chicken wars between restaurants this summer when it launched a crispy sandwich– the first time the 47-year-old chain had rolled out a chicken sandwich nationally. The sandwich features filets from small-breasted birds, which tend to be favored by retailers and are in tighter supply than large-size birds. But supplies are low and producers have pre-existing commitments with competitors.

It turns out the chicken-sandwich sales far exceeded the Popeyes’ expectations, reports The Wall Street Journal (Oct. 28, 2019). A viral social-media campaign fueled by snarky exchanges between Popeyes and competitors led to lines out the door at many of its 2,400 U.S. locations. Customers who couldn’t get a sandwich grew angry and desperate. Many owners initially hoped to sell more than 60 sandwiches a day, but some went through 1,000 instead. Popeyes announced at the end of August that it had run out of the sandwich. The company went through a supply intended for 3 months in 14 days!

So Popeyes has spent much of the past 2 months securing suppliers that could meet its specifications for quantity and small-breast size of the item’s poultry. The lengthy amount of time Popeyes is taking in bringing the sandwich back highlights the supply-chain high-wire acts that can go on behind the scenes as restaurants try to move quickly to meet consumer tastes, and how forecasting and reality can diverge wildly even after 2 years of testing a new product. Competitors, hoping to satisfy the craving, have stepped in, with McDonald’s testing a new spicy chicken sandwich last month. Getting ready for its relaunch next month, Popeyes franchises have been hiring staff.

Supply crunches have hit other chains testing new menu items. Chipotle warned last week that it would likely run out of its new carne asada steak offering as early as next month after demand exceeded expectations.

Classroom discussion questions:

  1. What supply chain mistakes did Popeyes make?
  2.  What forecasting techniques (see Ch. 4) could Popeyes have used for this new product?

OM in the News: Merck’s Move to Prevent Drug Shortages

Merck, the Germany-based pharmaceutical, needs to stockpile medications to make sure it has enough on hand because some expire before they can be used. Its supply-and-demand forecasts are about 85% accurate. To sharpen its predictions, Merck plans to use analytics and machine learning to predict and prevent drug shortages, a move that could also save it money. Its new platform, from TraceLink Inc., can analyze data in real time from organizations within Merck’s supply chain, including pharmacies, hospitals and wholesalers.

The U.S. had 600-1,200 drug shortages every year from 2014 and 2019, reports The Wall Street Journal (Oct. 15, 2019). Shortages can happen due to issues with manufacturing, supply-and-demand forecasts, and natural disasters. Drugs in short supply have included antibiotics, chemotherapy and cardiovascular treatments. More precise supply-and-demand forecasts mean pharmaceuticals could save hundreds of millions of dollars annually, a benefit of not having excess drugs on hand and avoiding expedited shipment costs.

On average, pharmaceutical companies carry 156 days of inventory. For retailers selling consumer products, it is 78 days. For IT equipment, it is 57 days. Pharmaceuticals traditionally have predicted demand for drugs based on historical data and input from sales teams. But as many as 10 entities handle a drug before it gets to a patient, including manufacturers, pharmacies and wholesale distributors. “It’s a highly complex supply chain,” said TraceLink’s CEO. The TraceLink network includes data from more than 275,000 organizations world-wide, including hospitals, retail pharmacies, wholesale distributors and drugmakers.

TraceLink’s algorithms give Merck signals about the days of inventory for a specific drug and how long it will take for a drug to get to a particular phase in the supply chain. A better supply-and-demand forecast also makes it easier for Merck to expand into locations without a reliable supply-chain infrastructure, such as parts of Africa and Southeast Asia.

Classroom discussion questions:

  1. Why do pharm firms carry such a large inventory?
  2.  How might data analytics improve forecasting at Merck?

Guest Post: Student Perspective on the MyOMLab Forecasting Simulation

Wende Huehn-Brown is Professor of Supply Chain Management at St. Petersburg College in Florida.

This post is a followup on my prior Guest Post (April 15, 2019). Today, I would like to share my students’ perspective on the forecasting simulation in MyOMlab. It deals with the retail industry as operations consultant. The students enjoyed this because of their own experiences in retail and as customers.

I teach this class online and having further online resources in MyOMlab to enable student learning is great! Sure, I have hundreds of pencasts and tutorials on doing the analytics, but the simulations are a practical approach to learning the lessons. Do you remember using a graphing calculator? I don’t, so was surprised to have 40% of the students talking about that old forecasting method! They also commented on how they learned to use ExcelOM and found it more accurate and faster with less steps.

Not only does the simulation provide students with further insight on applying the lesson and using technology for analytics, but also the events that happen during the simulation are realistic. Many of my students commented on connecting this simulation to the real world was quite enlightening to consider how the events may affect supply and demand–such as how external conditions can affect market prices.

They also got quite excited when they saw their accuracy improve, even to 0% error. If you can keep the MAPE relatively low, you even get a $10,000 bonus in the simulation. 60% of the students commented on how this imaginary bonus helped to motivate them and keep them focused on achieving the 10% MAPE goal. I guess even in a simulation incentives are motivating!

Students enjoyed how the simulation made learning fun. Several students commented how they want to plan more time to do it again to further improve. One student reflected on a on a key lesson he learned regarding wasting time with non-algorithmic solutions. The simulation showed him to have more faith in his spreadsheet modeling skills.

OM in the News: How AI Powers Amazon’s 1-Hour Deliveries

Amazon boxes are scanned on conveyor belts. AI systems keep track of all items in the warehouses, which can be as vast as 1 million square feet.

By the time someone clicks “buy” on Amazon, its Supply Chain Optimization Technologies team has probably expected it.  The team forecasts demand for everything sold by Amazon worldwide and  underlies the entire Amazon retail operation. Launching their fastest service, Prime Now, Amazon now delivers household basics within hours, thanks to artificial intelligence.

With AI, computers analyze reams of data, making decisions and performing tasks that typically require human intelligence. AI is key to Amazon’s retail forecasting, writes Supply & Demand Chain Executive (Nov. 28, 2018).  It is also a key to how Amazon speeds up deliveries: The team predicts exactly where items should be stocked so that they are as close as possible to the people who will buy them, an essential process with the race for same-day and even same-hour delivery. Few other retailers have ventured into these speeds, because they’re very expensive. AI is woven through every part of an Amazon purchase, from the website to the warehouses to the actual delivery. The firm calls it the “first mile,” “middle mile” and “last mile.”

In 2013, Amazon got a patent for “anticipatory shipping.” The idea was to get an order as close as possible to the customer’s address before the customer actually click “buy.” Since then, Amazon has built a massive warehousing footprint around the country, with smaller warehouses closer to city centers where Prime Now promotes super-fast delivery.

Amazon is also now rolling out new efficiency-boosting technology that eliminates the need for the handheld scanners we show in the Chapter 12 Global Profile. The new system retrofits workers’ stations with advanced cameras that can automatically scan items that workers hold in their hands. This kind of innovation is a controversial, where retail store layoffs are rampant, just as automation is reshaping the workforce.

Classroom discussion questions:

  1. What are the operations issues discussed in this article?
  2. How is AI used at Amazon?

OM in the News: Apple Suppliers Suffer With Uncertainty

Apple CEO Tim Cook at an Apple store in Italy,

Lower-than-expected demand for Apple’s new iPhones and the company’s decision to offer more models have created turmoil along its supply chain and made it harder for Apple to predict the number of components and phones it needs, writes The Wall Street Journal (Nov. 20, 2018).

Recently, Apple slashed production orders for all 3 of the iPhone models it unveiled in September, frustrating Apple suppliers and workers who assemble the phones and their components. The slowdown has ripped throughout Apple’s supply chain.

Big suppliers of iPhone components, including Qorvo, Lumentum, and Japan Display, cut their quarterly profit estimates, implying a reduction in previously placed orders from Apple, which accounts for 1/3-1/2 of their revenue. At Foxconn , Apple’s largest iPhone assembler, thousands of workers have voluntarily left its Chinese plants earlier than they intended after Foxconn cut overtime hours that typically are available. (Many workers rely on overtime as a major source of income).

Hundreds of suppliers built their businesses on the back of smartphones, and none benefited more than those providing components for Apple. But the iPhone production cuts have reignited frustration among suppliers and raised worries about Apple’s ability to forecast demand since it started releasing 3 flagship models instead of 2 last year. Apple also continues to sell some older models in its stores, further complicating forecasting.

The company’s suppliers have been rattled before. The iPhone 6, introduced in 2014, sold better than Apple’s expectations, and suppliers scrambled to meet increased orders. The following year, demand for the iPhone 6s fell short of forecasts, leaving suppliers to grapple with excess inventories and underused production capacity. Last year, many suppliers were hurt by Apple’s excessively optimistic production forecast for the iPhone X, which it later slashed by some 20 million units for the 2018 first quarter.

While making components for 200 million-plus iPhones remains a tremendous business for suppliers, most relied on the growth in iPhones sold to boost their profits and pay for huge capital expenditures. “The freeway of Apple suppliers is littered with roadkill,” said one industry analyst.

Classroom discussion questions:

  1. What forecasting techniques can be used by Apple to predict demand for a new phone?
  2. What are the advantages and disadvantages of being an iPhone supplier?

OM in the News: UPS Forecasting Project Will Improve Logistics Planning

Packages at the new UPS hub in Paris

United Parcel Service is working on an ambitious analytics and machine learning project to gather and consolidate data from various applications within the company’s logistics network to better predict package flow, volume and delivery status, writes The Wall Street Journal (July 17, 2018). The predictive analytics tool will gather and analyze more than 1 billion data points per day at full-scale, including data about package weight, shape and size, as well as forecast, capacity and customer data. This allows UPS to know exactly what’s going where, and when it’s going to arrive, much more accurately than before.

The project is an example of how UPS is upgrading technology systems as it faces heavy competition from rivals including FedEx and Amazon as well as ever-growing e-commerce shopping demands. The company still relies on some outdated equipment and manual processes, but it’s opening new automated facilities and working on technology upgrades, such as this one, as part of a $20 billion capital spending plan.

It will give staff more accurate forecasts about the package volume that needs to be processed at UPS facilities on any given day. That will give employees enough lead time to determine whether they need more resources at package and sorting facilities in the event of a higher-volume day. Predictive analytics also could help eliminate bottlenecks in the supply chain because of unforeseen weather or emergency situations. Knowing how upcoming inclement weather will impact the supply chain days in advance will result in better planning.

Developing the tool was an ambitious feat because of how many hundreds of millions of data points needed to be consolidated into one single platform. Until now, forecast, capacity, customer and package data was housed in different applications. The tool is expected to be available to UPS employees by the end of the year via a smartphone, desktop and tablet application.

Classroom discussion questions:

  1. Why is this project so important to UPS?
  2. Why is the forecasting system so complex?

Guest Post: Productivity, Forecasting and Excel with Real Data

Our Guest Post today comes from Howard Weiss, who is Professor of Operations Management at Temple University. Howard has developed both POM for Windows and Excel OM for our text.

I often search the web for real data that I can use for forecasting, and just came across data from Lowes 10 – Year Financial Information report that can be used for both productivity and forecasting.

The report has 5 sections, with 2 that are of major interest to OM. The 1st is titled “Stores and People” and lists the productivity inputs and outputs of: (1)Number of stores; (2)Selling square feet; (3)Number of employees; (4)Total customer transactions; (5)Average ticket.

The next section includes the net sales. I have the students perform several exercises using these data. Here are 5 years of past data.

The Exercises

Exercise 1 – Data integrity:  For each of the years the net sales should be equal to the anticipated net sales (my definition) given by the average ticket multiplied by the number of transactions. Of course, the anticipated and reported net sales are not exactly equal. I ask the students to compute the percentage difference between the reported net sales and the anticipated net sales and also to determine the MAPE differences.

Exercise 2 – Productivity:  For each year, there are 3 productivity measures that can be computed comparing net sales to number of stores, selling square feet and number of employees. Unfortunately, there are no multipliers available to compute the multifactor productivity measures for the 10 years.

Exercise 3 – Productivity change: For all years except the first, I ask the students to compute the productivity change for each of the 3 productivity measures. There is one small issue the students need to recognize. The data is given as most recent first.

Exercise 4 –Graph in Excel: I ask the students to graph the 3 sets of productivity measures. If the students create scatter graphs using the dates in row 3 and the productivity measures that they create in a row below the data then the graph will be fine. If the students create a line graph using only the computed productivity measures then the graph will run backwards. That is, the time axis will be backwards. This is important for the final exercise.

Exercise 5 – Regression/Trend Line – I ask the students to draw a regression/trend line for each of the three measures. I have shown my students that right-clicking on the graph is the easiest way to create the line. I also ask the students to find the three average productivity changes based on the slope of the line in each of the three graphs.

The students very much appreciate applying Productivity to real data, using data that has more than 2 periods and having the opportunity to work in Excel, especially with the graphing capability and regression capability within the graph option.

Good OM Reading: Picking the Right Forecasting Technique

forecasting“Companies routinely rank demand planning immaturity as a major obstacle in meeting their supply chain goals,” suggests a new white paper called Eight Methods that Improve Forecasting Accuracy. But accurate forecasts are the foundation for profitable business growth. Optimal demand planning and forecasting requires comprehensive modeling capabilities plus the flexibility and ease-of-use to shift methods as life cycles progress and market conditions change.
Attribute-based methods that use demand profiles are often suited to new product introduction and end of product life cycles, at times when reliable historical demand data is lacking or the available data is less relevant.
At the more mature stages of the product life cycle, 5 different time-series statistical models come into play, including modified Holt, Holt-Winters, moving average, and intermittent or low demand. These models are used to create retrospective forecasts that cover prior periods (typically 3 years) of documented demand. The forecasts are then matched to actual demand history to determine which one best fits the real-world data. The best-fit winner is used to create an objective base forecast.
Causal methods are used throughout the life cycle to adjust forecasts in anticipation of promotional events. Causal methods allow planners to predict how discounting and other promotional factors will affect volume, and layer the impact of these events on top of the underlying base forecast.
Finally, derived models can be used to create a Parent-Child relationship in which forecasts for closely related products are driven as a percentage of the forecast for a ‘leader’ product. This ensures that when the forecast is modified for the ‘parent’ all the ‘child’ forecasts would be updated accordingly.
To prevail in a business economy shaped by uncertain demand and rapid market changes, all of these forecasting methods must be harnessed. Forecasting software can automate much of the selection and switching of methods as a product moves through its life cycle. A best-in-class forecasting system is one that provides flexibility for users to weight elements and override key parameters in the forecast calculation based on their intuitive knowledge and market expertise.

Teaching Tip: Our New Forecasting Classroom Simulation

This Forecasting Classroom Simulation is the 1st of our new classroom gaming exercises. It accompanies Chapter 4, Forecasting, and is free within our MyOMLab learning system.

Activity Brief

As an operations consultant, you have just signed a 2 year contract to provide monthly forecasts of customer demand for a new gas station.  The gas station will sell 3 types of gas: Regular, MidGrade, and Premium. The gas station will have a total of 8 pumps offering all three types.

The gas station will also have a modest convenient store with a standard selection of snacks, beverages, and other miscellaneous items. However, the ownership group believes the station will attract business primarily due to its prime location near a major highway. Pricing for gas will be comparable to alternatives in the area and will predominantly be driven by market conditions relating to the price of crude oil per barrel.

The ability to forecast the next month forecast is critical for the station’s inventory management and other business planning. It will be necessary to gather various sources of information and ultimately analyze data in order to make the best forecast for each of the 24 months of the contract.

Your performance will be based on the collective mean absolute percentage error (MAPE) among the three types of gas. If you are able to forecast at less than or equal to 5% MAPE, you will receive a $10,000 bonus for your work. If your forecast are between 5% and 20% MAPE, you will not receive the bonus, but you will secure the position and receive a contract renewal. If the MAPE exceeds 20%, you will not receive a contract renewal.

Learning Objectives

  • Understand and break down patterns of customer demand
  • Generate forecasting models based on judgement, causal, time-series methods, or seasonal methods
  • Evaluate the quality of a forecast model using error metrics (specifically mean absolute percentage error).
  • Help students understand the distinction between the “signal” and the “noise” (Students are encouraged to also read The Signal and the Noise: Why So Many Predictions Fail, but Some Don’t. by Nate Silver). Many aspects of customer demand variation are explainable – the signal, but there needs to be an acceptance of unexplainable variation – the noise. In other words, students have to make a concession that their models will not predict customer demand with 100% accuracy.

Industry: Retailforecast sim 2forecast sim 1

MyOMLab: Our Four New OM Simulations

We are thrilled to announce that our learning package now includes some pretty sophisticated OM simulations. Here is a bit of background information.

  • How many simulations will be part of OM Simulation?  We have four gaming simulations: inventory management (chapter 12), quality control (chapter 6), forecasting (chapter 4), and project management (chapter 3). A fifth, supply chain management (chapter 11), will be available in late Fall.
  • Are these simulation to be done in class or outside of class?  The OM simulations are fully assignable through MyOMLab, so students could complete this as homework presumably after completing their reading. It would also work as an in-class activity, either working as an individual or as part of a team.
  • Are the OM simulations smartphone compatible?  The OM sims are compatible for mobile devices including smartphones in landscape orientation.  However the simulations are optimized for desktop/laptop devices.  Our research suggests that for activities of this length, most students still prefer desktop/laptop use.
  • Are the OM simulations accessible?  Yes, the OM simulations have been developed with a number of accessibility features including compatibility with screen reader devices.
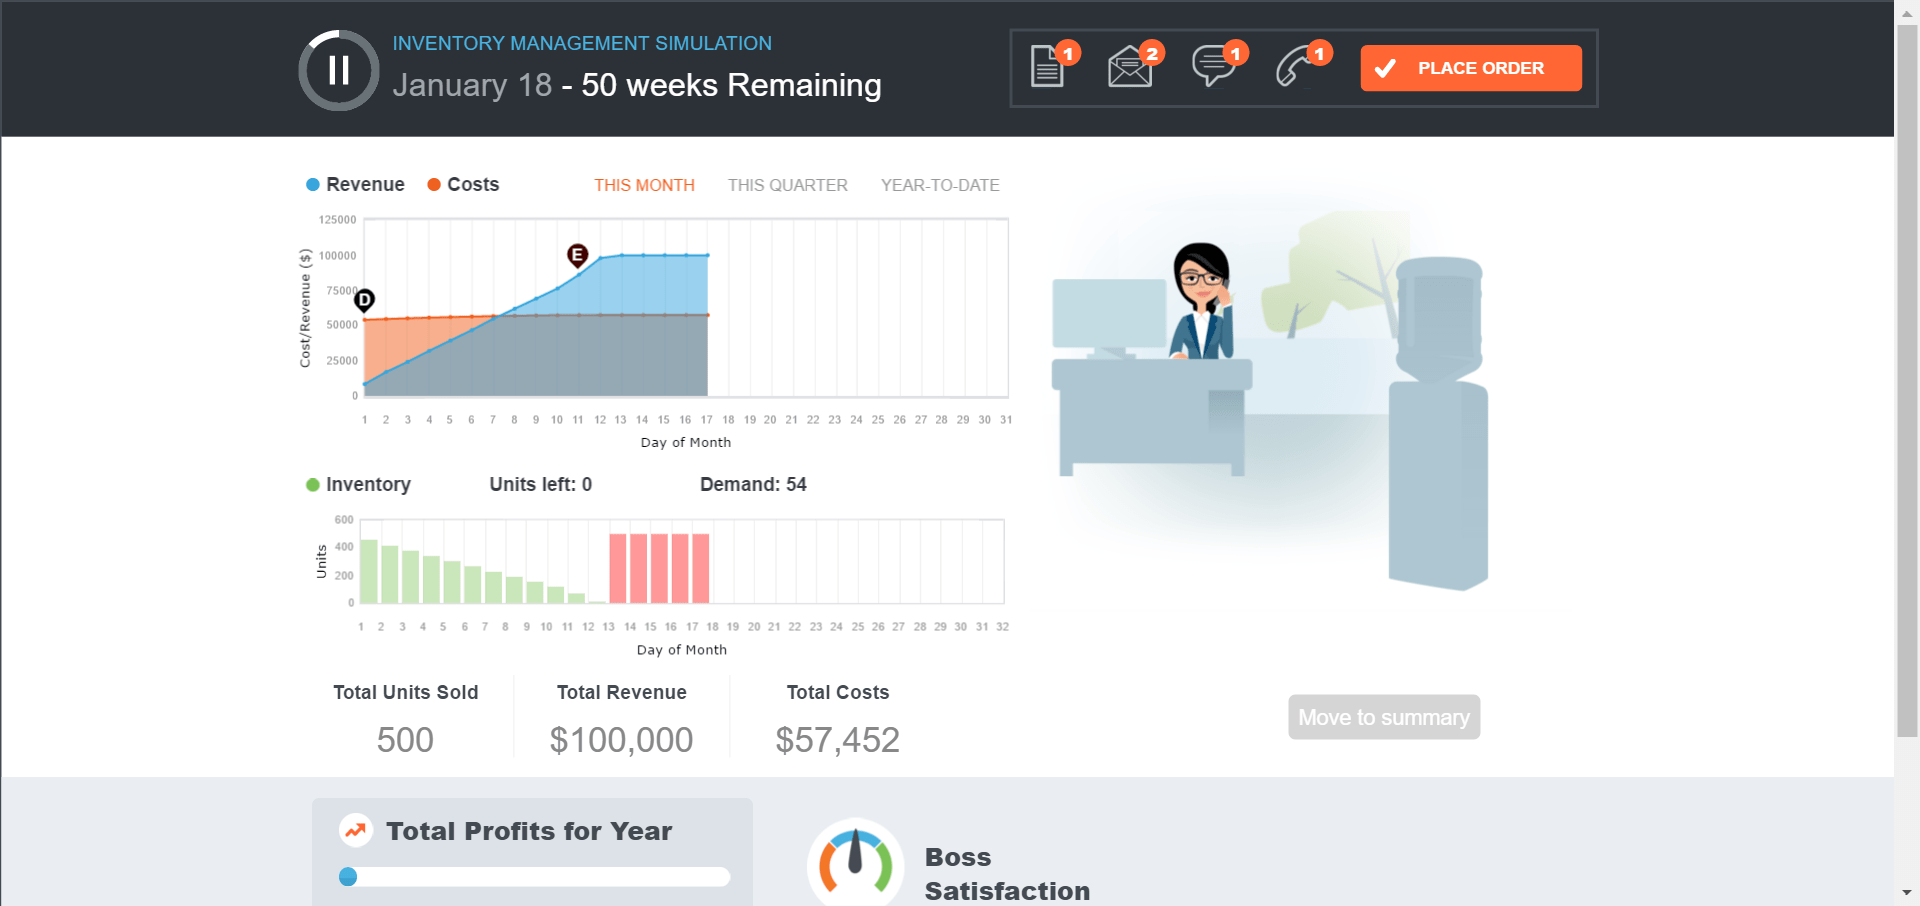
  • Can you pause the simulations?  Yes, you can pause all of the simulations to review the artifacts (documents, emails, voicemails, texts) or make a decision.
  • What is the price of the OM simulations?  Access to simulations is through MyOMLab and included in that purchase cost. There is no additional fee to purchase these simulations on top of the MyOMLab purchase.simulation


Guest Post: A Tip on Teaching How to Convert Quarterly Trends to Annual Trends


HowardWeiss2Howard Weiss is Professor of Operations Management at Temple University. He has developed both POM for Windows and Excel OM for our text.

At the recent POMS conference I asked the audience: “If the quarterly trend is an increase of 100 units, then what is the annual trend?” The answer I received was, “It is so obviously 400 units year that this must be a trick question.” This is the same answer my students typically give when I ask the question.

Below is a spreadsheet displaying “perfect” data that starts at 10000 and increases at exactly 100 per quarter.blog.trend.Fig1


You can easily see that the annual increases are 1600 since each of the 4 quarters increases by 400 from year to year. Thus, the annual trend is 16 times the quarterly trend.

While the data above is contrived, the analysis holds for “real” data. The spreadsheet below shows the revenue at Coca-Cola (after all, the conference was in Atlanta) from 2008 to 2013.

The quarterly trend is an increase of 242 as shown in the graph, the annual trend using Excel’s SLOPE function is an increase of 3916 per year, and the ratio of the annual trend to the quarterly trend is just above 16 for this “real” data. Typically, I have my students use data from their own companies and more often than not, the ratio is near 16 for quarterly data or 144 for monthly data.blog.regressCocaCola


Other ideas on teaching forecasting can be found in “Let’s Put the Seasonality and Trend in Decomposition”, R. L. Nydick and H. J. Weiss.

Teaching Tip: NYC’s Potholes and Regression Analysis

potholeNew York is famous for many things, but one it does not like to be known for is its large and numerous potholes. David Letterman used to joke: “There is a pothole so big on 8th Avenue, it has its own Starbucks in it.” When it comes to potholes, some years seem to be worse than others. This winter was an exceptionally bad year. City workers filled a record 300,000 potholes during the first 4 months of 2014. That’s an astounding accomplishment.

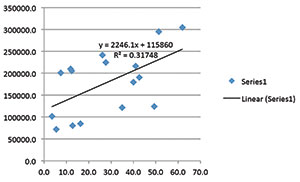
But potholes are to some extent a measure of municipal competence–and are costly in many ways. NYC’s poor streets cost the average motorist an estimated $800 per year in repair work and new tires. There has been a steady and dramatic increase in potholes from around 70,000- 80,000 in the 1990s to the devastatingly high 200,000- 300,000 range in the most recent years. One theory is that bad weather causes the potholes, writes OR/MS Today (June, 2014). Using inches of snowfall as a measure of the severity of the winter, the graph on the left shows a plot of the number of potholes vs. the inches of snow each winter. (R-squared = .32).Pothole-analytics

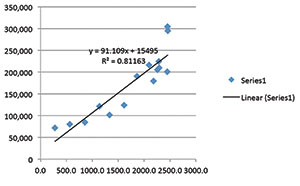
Research showed that the city would need to resurface at least 1,000 miles of roads per year just to stay even with road deterioration. Any amount below that would contribute to a “gap” or backlog of streets needing repair. The right-side graph shows the plot of potholes vs. the gap. With an R-squared of .81, there is a very strong relationship between the increase in the “gap” and the number of potholes. It is obvious that the real reason for the steady and substantial increase in the number of potholes is due to the increasing gap in road resurfacing.Pothole-analytics2

A third model performs a regression analysis using the resurfacing gap and inches of snow as 2 independent variables and number of potholes as the dependent variable. That regression model’s R squared is .91.

Potholes = 7801.5 + 80.6 * Resurfacing Gap + 930.1 * Inches of Snow

We are always looking for real-world, down-to-earth examples of forecasting models to share with classes. This may do the job!