Guest Post: Shipping Risks in the Supply Chain

Prof. Howard Weiss shares his insights with our readers monthly.

Table 11.3 in the Supply Chain Management chapter in your Heizer/Render/Munson textbook discusses supply chain risks and tactics to minimize the risks. One of the risks that is mentioned is that distribution containers can be damaged, delayed or lost at the following points:

  • Sitting at a container yard
  • Handling at a container yard
  • Loading or unloading onto/from truck, train or ship
  • Enroute on truck, train or ship

Consider the three major modes of shipping – sea, rail and road and their associated risks. Many trillions of dollars in goods are transported via all modes annually.

Maritime Shipping. Currently there are about 6,000 container ships in operation globally. The largest of these can carry 24,000 twenty-foot containers or 12,000 forty-foot containers.

During the last decade an average of 1,300 containers were lost at sea. In 2022, 661 containers were lost. In 2024,  576 containers that were lost. A notable cause of container loss is severe weather. In the 2024, three incidents off the Cape of Good Hope resulted in losses of 99, 44, and 46 containers, respectively. The region is known for its rough seas. However, due to Houti terrorists in Yemen, more ships are rerouting around Africa instead of passing through the Red Sea, increasing exposure to such risks. (About 1/3 of lost containers are eventually recovered).

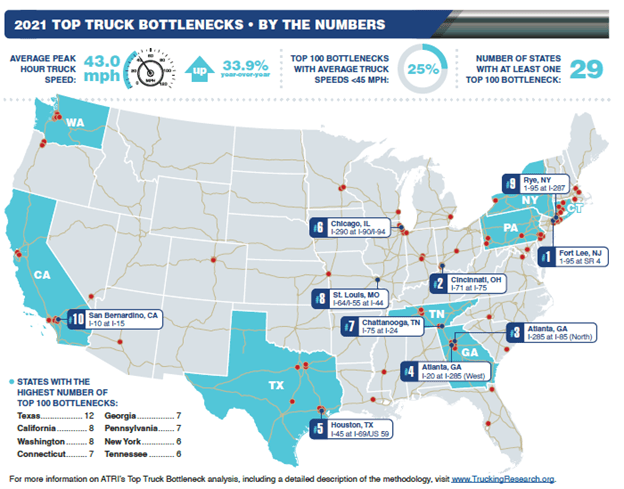
Trucking. Every year in the U.S., 3.5 million truckers travel 200 billion miles carrying $720 billion worth of goods. This is more than any other mode of shipping. Shipping containers by truck presents a different risk profile. While containers are rarely lost entirely, they are susceptible to damage and may be involved in traffic accidents, potentially causing property damage or hazardous material spills. There has been an average of 100,000 truck crashes per year.

Train Transport. Rail freight in the U.S. accounts for $210 billion worth of goods each year. The risks when using rail transportation are very similar to those with trucks. The key risks are derailments leading to significant damage and delays, cargo damage or release of hazardous materials and logistical disruptions due to infrastructure failures or collisions. The average number of rail accidents over the past decade has been 1,850.  

Regardless of the mode of transportation, most containers are insured against loss and salvage operations will be conducted especially when hazardous materials are involved.

Classroom discussion questions:

  1. What was the most expensive shipping disaster in the past decade?
  2. What can be done to lessen trucking losses?

OM in the News: Trucking’s Dirty Secret

Trucks traveling empty has both financial and environmental costs.

Every day, thousands of trucks drive along miles of freeways and highways completely empty — and the distances they drive with zero cargo onboard reaches many billions of miles every year. After a truck delivers its load, it may not have any goods to carry for the return leg of its journey and drives back empty. “I don’t think it is widely known,” said an industry veteran.

The problem of empty trucks has gotten worse in Europe, with the proportion of mileage driven by vehicles with zero cargo going up, reports CNBC (Sept. 12, 2022). In the EU, trucks clocked up so-called “deadhead” distances of around 21 billion miles in 2021. This equates to more than a fifth of the total distance traveled by road freight in the bloc last year, up from 20% in 2020.

By its nature, the road freight industry is complex: manufacturers or retailers that need to transport goods are in myriad locations, shipping varying amounts of cargo to many destinations, sometimes relying on multiple carriers to do so.

Trucking companies ideally need one customer (or customers) for the outward journey and another for the return. If they don’t have two customers, vehicles run empty. But, as well as needing a shipment for the return journey, they also need a truck that matches their load, with equipment such as refrigeration or a vehicle with a fork-lift attached. Some haulers still book deliveries via phone or email. This means information about what is being sent where isn’t always centrally held, making it harder to find shipments to fill trucks for the return leg.

In the U.S., meanwhile, the distances driven by empty trucks decreased from 21% in 2020 to 15% in 2021. Under the pressure of rising fuel prices, carriers achieved some of the lowest deadhead mileage in years. But running trucks without loads is still a problem, especially since costs are going up: U.S domestic freight rates increased 28% this year (across all modes of transport including road and air), reaching a potential peak. Empty miles mean less revenue for carriers. It means increased costs because an empty truck on the road still consumes fuel, still needs a driver, and still requires regular maintenance.

Classroom discussion questions:

  1. What is the solution to “deadheading”?
  2. Why is the problem bigger in the EU than in the US?

OM in the News: Spring Is Here but Sandals and Shorts Aren’t

Seasonal items are slow to hit store shelves at Luluemon

It is almost spring, yet many retailers are still waiting for deliveries of shorts, sandals and other warm weather gear, a sign that the supply-chain problems of the past two years haven’t abated. It is estimated that retailers will see average delays of one to two months on shipments this spring.

Retail chains, including Lululemon Athletica, Kohl’s, and Abercrombie & Fitch, said that supply-chain delays hurt holiday sales. Those problems are continuing well into the new year.

Macy’s said the chain is facing shortages of women’s shoes, handbags and toys. “There’s still a fair amount of supply-chain disruption when you think about between 60 and 70 vessels still anchored off Long Beach in L.A. trying to get in,” says the Foot Locker CEO.

Exacerbating the crunch is strong consumer spending that is pitting surging demand against limited supplies, writes The Wall Street Journal (March 10, 2022). After two years of Covid-19-related restrictions, retailers are betting that consumers are eager to update their wardrobes as they head back to the office, travel and attend more social engagements.

While large chains such as Walmart and Home Depot worked to sidestep some of the delays by chartering their own ships, the problem now is less about transporting goods across the ocean and more about a shortage of truckers in the U.S. Many chains are placing orders with overseas factories earlier, and paying hefty sums to fly the goods to the U.S. But that isn’t necessarily solving the problem, and it ties up capital in inventory.

As of last month, Untuckit was waiting for 177,000 items that should have arrived at the end of December, equating to about $15 million in lost revenue. For the spring, Untuckit bumped up orders by two months and is flying in goods for as much as $10 a shirt.

Classroom discussion questions:

  1. What are the signs that supply lines will improve this year?
  2. Signs that they will stay strained?

Guest Post: Location Factors Revisited–Trucking

Prof. Howard Weiss provides today’s guest post. Howard is the creator of the Excel OM and POM software that comes free with our text.

Bottlenecks cost the U.S. economy more than $42 billion in 2019, according to Federal Highway Administration data, and freight shipments suffered almost 660 million hours of delay on the nation’s roadways. Trucks experienced over 27 million days of delays with 1/3 occurring on interstates.

The American Transportation Research Institute (ATRI) has recently issued a report detailing the top 100 traffic bottlenecks in the U.S. based on GPS data from more than one million trucks at 300 specific locations. Figure 8.1 of your Heizer/Render/Munson textbook points out that one of the important site location factors is “air, rail, highway, and waterway systems” and Chapter 11 notes that “the vast majority of manufactured goods moves by truck” –which is 73% of the value of the freight. This makes the information in the ATRI report one of the critical factors when selecting a location and/or trying to reduce costs in the supply chain. The figure below shows the top 10 congestion sites in the report.

Of course, COVID has had a major effect on congestion. One study indicated that in February 2020 congestion increased due to panic-buying consumer demand. Another study showed that in March 2020 congestion decreased due to less volume of traffic on the road. On the other hand, congestion increased in 2020 because more road construction projects were able to begin and move at a faster pace due to the reduction in travel. Overall, truck speed was up 34% in 2020 compared to 2019.

Classroom Discussion Questions

  1. Amazon has chosen to locate its HQ2 on the East Coast where there is a great deal of congestion. What reasons aside from transportation would lead Amazon to make this regional decision?
  2. Does proximity to markets explain some of the reasons for the bottlenecks?


OM in the News: The Rise of the Self-Driving Truck

Whatever type of vehicle arrives at the Bay Area headquarters of Aurora, the team can have it running without a driver in just 12 weeks. The transformation involves pulling apart the dashboard, fitting the vehicle with a stack of sensors and computer systems, then installing a “single umbilical” cord to communicate between the vehicle and the self-driving technology.

Aurora has integrated its robotic “Driver” into eight types of vehicle since its founding in 2017. But its system is proving most successful in heavy-duty trucks, which are now a main battleground for autonomous technology as the mass rollout of robotaxis falters. Partnering with Volvo Trucks, Peterbilt, and Kenworth, with a combined US market share of more than 50%, Aurora is a big force in driverless trucking.

truck2

The business case for disrupting the $800 billion U.S. trucking market is clear, writes the Financial Times (March 31, 2021). Two-thirds of America’s consumer goods are transported to market by truck, but laws limiting drivers’ shifts to a maximum of 11 hours mean longer journeys often take several days.

On average 20% of miles driven are empty and not generating revenue, but still generating gas emissions and pollution. The potential for automation to drive consolidation could be easily as big as for cars, as trucks drive 170 billion miles on U.S. highways every year.

Until recently, Silicon Valley has been slow to react to the opportunity. Since Google launched its self-driving car project in 2009, robotaxis have been the sector’s focal point.

A major benefit of self-driving trucks is that the technology they require is simpler to develop. For a driverless ride-hailing service to exist, the car needs to take passengers anywhere in the city. That would require continual mapping to stay up to date, whereas 18-wheelers spend the bulk of their time on the same highways. “It’s basically a straight road where you’re not really even shifting gears, much less having the opportunity to run into a building,” said one industry expert.

Classroom discussion questions:

  1. Why is the potential so great for self-driving trucks ?
  2. What are the weaknesses in using self-driving long-haul trucks?

OM in the News: Using AI to Keep Trucks on the Road

“In the trucking industry, few things will sour a manager’s mood like a mechanical failure disabling an 18-wheel rig in the middle of a big delivery,” writes The Wall Street Journal (March 12, 2019). But if mechanics can predict when a pump or cable or other component is about to fail, they can avoid having a truck stuck on the side of the road.

NFI Industries Inc., a $2 billion N.J.-based company, is using artificial intelligence to anticipate when the truck components in its 2,200 tractors and 9,700 trailers need adjusting or replacing. By predicting maintenance and reducing malfunctions, NFI expects to reduce truck maintenance and repair costs by 7%, or $1.5-$2 million a year.

NFI’s data is taken from truck sensors, odometers, speedometers, repair logs, temperature logs and other sources. The information collected includes truck ages, route distances, payload weights, weather conditions, driving conditions, and even the braking and accelerating styles of individual drivers. That data is analyzed by Noodle.ai, a San Francisco startup that pushes the information through a supercomputer nicknamed The Beast. Noodle.ai’s machine learning technology synthesizes the disparate bits of data to determine when a $100,000 rig needs an oil change, a filter replacement, a brake adjustment or a new set of tires.

As a result, NFI is jettisoning a sacrosanct industry ritual: regular truck maintenance and mandatory oil changes every 30,000 miles. Instead, the company is switching to less frequent tuneups, as prescribed by AI, that are based on a truck’s age, wear, driving conditions and a host of other factors. NFI’s trucks break down about twice a year, on average. The company expects predictive maintenance to reduce those mishaps to 1.5 breakdowns a year per truck. Among the surprising insights AI has produced: NFI had been procuring a truck model from a manufacturer that offered a $10,000 purchase incentive per truck. But over a lifespan of five to six years, that truck model was costing NFI about $25,000 more in maintenance and repair than other trucks.

Classroom discussion questions:

  1. What is the difference between predictive and preventive maintenance?
  2. What is the role of AI at NFI?

OM in the News: Fuel Alternative Trucks Aid Sustainability at UPS

UPS is boosting its fleet of compressed natural-gas vehicles by about 19%

United Parcel Service Inc. is growing its fleet of alternative-fuel trucks as the delivery giant pushes to reduce fuel costs and vehicle emissions. The parcel carrier is spending $130 million to buy 730 compressed natural-gas vehicles, boosting its current CNG fleet by about 19%, and to add five CNG fueling stations to its existing network of more than 50 stations. The UPS investment is part of a broader effort to trim the company’s greenhouse-gas emissions from its ground operations by 12% by 2025, reports The Wall Street Journal (June 20, 2018).

Fuel is historically the biggest expense for transportation companies. While diesel prices dipped in 2015 and 2016, the cost has been climbing again. Companies are exploring alternatives. In recent months, trucking operator U.S. Xpress and beer-maker Anheuser-Busch, have reserved hundreds of hydrogen-electric trucks from Nikola Motor. Companies are also lining up to test out Tesla Inc.’s all-electric Semi big rig, Still, alternative-fuel vehicles account for a slim portion of the overall truck market. New models provide significantly better fuel economy than a decade ago.

In UPS’s case, by 2020 the company aims to have one in four new vehicles purchased be an alternative fuel or advanced technology vehicle, such as a hybrid truck or one incorporating lightweight materials that improve fuel efficiency. It also wants to swap out 40% of all fuel for its ground operations with sources other than conventional gasoline and diesel. Between 2008 and 2018 UPS will have invested more than $1 billion in alternative-fuel and advanced-technology vehicles and fueling stations. The volume of goods moved by truck continues to grow in the U.S.

Classroom discussion questions:

  1. What model in Supplement 5 of the text can trucking companies employ in decisions such as these?
  2. Why is UPS spending so heavily on its fleet?


OM in the News: The “Amazon Effect” on Logistics


A growing number of companies are paying to track in real time everything from truckloads of pork chops to shipping containers full of exercise equipment. Logistics providers, retailers and suppliers are inking deals with software firms that use location data and weather and traffic information to monitor shipments and alert customers to events that could hold up delivery, such as a loaded truck sitting in a yard for more than an hour.

The need for these services is growing as retailers and shoppers demand faster, more-precise delivery. Many Amazon customers have become accustomed to reliable 2-day shipping, forcing other retailers to offer similar service. Businesses are making new demands of their suppliers as they trim inventories and reduce supply-chain costs. Last month, Wal-Mart said it would penalize companies that made deliveries too late or too early. “It’s the Amazon effect—customers are putting more pressure on their supplier to know where their product is,” said a supply chain analyst with Gartner.

Pork producer Smithfield Foods hires more than 230 trucking companies to ship about 1,000 truckloads of product in the U.S. a day. “Managing that is an awful lot of phone calls,” said the firm’s VP of supply chain. Smithfield’s on-time delivery rate improved to 94%, from 87%, after it began tracking truck freight with software.

With this article in The Wall Street Journal (Aug. 30, 2017), we see that some businesses are using delivery speed as a way reach competitive advantage, as illustrated in Figure 2.4 in the text.

Classroom discussion questions:

  1. What are other OM strategies for competitive advantage?
  2. Name some of the leading software providers that help track shipments.

OM in the News: Amazon Explores an Uber for Trucking

amazontruck“With an eye toward moving deeper into the $800 billion trucking industry, Amazon is quietly building an app that matches truck drivers with shippers,” reports Business Insider (Dec. 15, 2016). The app would work the same as Uber but would be for truck drivers to find shippers that need goods moved. The advantage for Amazon is that it would eliminate the need for a third-party broker, which typically charges a commission of 15% for doing the middleman work. (This is a great article to share with your students when you discuss the Uber Technologies, Inc., case in Chapter 1).

The app will offer real-time pricing and driving directions, as well as personalized features such as truck-stop recommendations and a suggested “tour” of loads to pick up and drop off. It could also have tracking and payment options to speed up the entire shipping process.

This is part of a larger plan by Amazon to become a full-scale logistics company that controls the entire delivery cycle. Over the past year, Amazon has purchased thousands of trailer trucks and dozens of cargo planes while launching new “last mile” services like Amazon Flex that take packages straight to the end customer.

The new service would put Amazon squarely in competition with numerous companies in this space, such as Convoy, Trucker Path, C.H. Robinson, and J.B. Hunt. Unlike its competitors, Amazon has an advantage in not having to worry about demand from the shipper’s side. To make an “Uber for trucking” marketplace work, you need demand from both sides of the equation — shippers and drivers. Amazon already has a giant shipping network and a rapidly growing package volume, so theoretically it shouldn’t be hard to find a load match for the drivers on its platform.

Amazon’s Minneapolis office is expected to have more than 100 engineers by next year working on this project, which is considered confidential. The opportunity is huge. Roughly 84% of freight spending is on trucking, and truck driving is the most common job in 29 U.S. states, but it’s a market that’s been slow to adopt new technologies.

Classroom discussion questions:

  1. Is this a core competency of Amazon?
  2. Why is Amazon entering this market?


Guest Post: The Uberization of Trucking

roseanneOur Guest post today comes from Roseanne Stanzione, who is CEO of LaneHoney, the Marketplace for Trucks On Demand

Uber’s taxi service is cool, right? Moving dots on a map tell you the location of the nearest taxi. Hop in and off you go, without handling cash.  And now venture investors have placed bets that the $60 billion truck brokerage industry of agents and phones can be disrupted with applications like Uber.

So what is the Uber magic anyway? Three things: 1) set up, 2) transact, 3) done. Uber is first and foremost a logistics application, one that eliminates transaction friction and makes better use of assets. The current truck shortage is the biggest real-time asset problem in America needing a smart, uncluttered answer. The current state of industry technology? Unfilterable bulletin boards, incomprehensible transportation management software that requires training to use, no price information and everyone drowning in paper.  It is no wonder 30% of backhauls go empty.

Set-Up is about simplifiying and automating the complexity of a transaction and placing it behind the scenes so that the transaction is front and center. To do that you need great data and handling, standard processes and documents, and of course, real time location. Transact is the real Uber magic. It’s genius Uber Experience (UX) that places the complex stuff behind the scenes and makes it effortless for users to oft in and hit “go.” UX will be a brand new competency required of logistics professionals to compete going forward. Done is realtime location that means trace for mobile dispatch, time-stamped delivery and accrued detention, putting “fuel surcharges” (a catch-all for additional brokerage charges) on death notice.  Better visiblilty means actionable data for enterprises, better margins, shorter miles, and the chance to be home for dinner.

Once all this Uber magic is in place, hard to do by the way, carriers get more offers, shippers get faster, cheaper shipments. That broker taking the most out of a transaction with an unknown spread fee becomes a relic.


OM in the News: Sustainability and Natural-Gas Truck Sales

A factor limiting natural-gas-powered truck sales is the arrival of new, more fuel efficient diesel engines

“In the midst of the strongest market for commercial trucks in 8 years, sales of natural-gas-powered haulers are just crawling along,” writes The Wall Street Journal (Aug.26, 2014). Higher purchase prices compared with diesel trucks, improved diesel fuel economy and continued scarcity of fueling stations are damping natural-gas-powered truck demand. Forecasters had expected sales to about double to 16,000 vehicles this year amid the trucking industry’s enthusiasm for natural gas a year ago, but only a 20% increase took place.

What happened? A big roadblock remains the premium for a heavy-duty gas truck—$50,000 more than the about $150,000 for a new diesel-powered truck. In theory, the payback for that higher price is recovered from fuel savings of $1.60-$1.70 for the gas equivalent of a gallon of diesel. Paybacks can average 4 years considering the average truck travels 125,000 miles a year. But fleet operators typically replace their vehicles every 3-4 years, leaving little time for them to benefit from the lower fuel costs of natural-gas-powered trucks. And the limited number of natural-gas refueling stations limits the switch to gas. Only about 750 natural-gas fueling stations are available in the U.S., and not all of these can accommodate large trucks.

The good news: UPS this year has ordered about 300 gas-powered heavy-duty trucks and bought 700 gas tractors last year. The trucks operate mostly in corridors in the West and South that have plenty of natural-gas stations, some of which UPS helped to finance. By the end of the year, about 2% of UPS’s 100,000 vehicles world-wide will be powered by natural gas. In addition, Wal-Mart, Office Depot, Lowe’s and P&G are among the companies requesting their trucking suppliers use natural-gas vehicles to comply with corporate policies to reduce carbon dioxide emissions and pollution caused by burning diesel fuel.

This article nicely complements our treatment of Life Cycle Ownership and Break-Even Analysis on p.195 in Supplement 5.

Classroom discussion questions:

1. What are the advantages and disadvantages of natural -gas-powered trucks?

2. Why have sales stalled?

OM in the News: Sustainabilty in Trucking Logistics

waste mangaement truckHere is a great article that ties into our new chapter, “Sustainability in the Supply Chain” and its Example S2 (see p. 195) dealing with life cycle ownership/break-even analysis.  The Wall Street Journal (Oct.30, 2013) writes: “Operators of some of the largest U.S. truck fleets, including Lowe’s , P&G, and UPS are accelerating a shift to natural gas fueled trucks, betting on new engine technology that promises to drop the cost of shifting from diesel fuel.”  Lowe’s wants its delivery company to shift all of its several hundred trucks to natural gas by 2017. P&G already has 7% of its trucks on gas and could reach as much as 20% within two years. UPS says it plans to buy 1,000 natural gas trucks by the end of next year. FedEx plans to shift 30% of its long-distance trucks to natural gas over the next decade.

The nation’s supply of relatively cheap natural gas is helping spur this shift. So are new natural gas engines that can power heavy-duty trucks that weigh up to 80,000 pounds. About 5% of all heavy-duty trucks sold next year will run on natural gas, up from 1% this year. Barriers to wider use are coming down, driven by the relatively low-cost of compressed natural gas, or CNG, which sells for about $1.50 less a gallon than its equivalent in diesel fuel, which averages about $3.87. Natural gas also produces less carbon dioxide, carbon monoxide and sulfur-based pollution than diesel or gasoline per mile driven. Diesel-engine trucks get 5-7 mpg and average 100,000 miles a year.

Waste Management, Inc. has converted 15% of its 22,000 truck fleet to natural gas, and  90% of its future purchases will be natural gas fueled, helping it save $15,000-$20,000 a year per truck, a 2-year payoff. The cost of the natural gas vehicles is still an issue. CNG trucks cost $40,000-$50,000 more than a diesel truck, which costs about $120,000. In large fleets, that premium could add millions of dollars to equipment cost.

Classroom discussion questions:

1. Why is the switch to CNG trucks an OM issue?

2. What factors are driving the change?

OM in the News: Fill ‘Er Up…With Natural Gas

LNG pump at Blu filling station in Salt Lake City

If you drive down I-15 in Beaver, Utah, you’ll see a 30-foot-tall silo with white letters that spell out “Blu.” Next to it is a truck stop. It is no ordinary truck stop. The silo contains liquefied natural gas (LNG) chilled to -200° F and ready to fuel specially outfitted 18-wheelers. The facility is owned by Blu Transfuels, which expects to build 50 natural-gas filling stations nationwide this year, according to Fortune (May 20, 2013).

Drawn to the vast potential of America’s fracking boom, Blu plans to convert natural gas into a liquefied form and use it to power the country’s fleet of 8 million heavy and medium-weight trucks, which account for 15% of U.S. oil consumption. The company’s partner, ENN, already operates 238 natural-gas stations in 59 cities in China. Blu’s VP of sales says, “LNG will allow our transportation fleet to save money and at the same time reduce its carbon footprint by 25%.”

Blu is not alone. Clean Energy, a company backed by T. Boone Pickens, says that it will have about 150 natural-gas stations in 33 states by year-end. Shell’s first LNG station opened in April in western Canada. Shell’s president says, “LNG has the potential to transform the transportation sector in a big way.”

The new LNG trucks should cost only $30,000 to $40,000 more than diesels. Given that a typical 18-wheeler travels 100,000 miles a year at 5 mpg and that LNG is about $1 to $1.50 a gallon cheaper than diesel, a driver can save as much as $30,000 a year in fuel — a one-year payback. Many trucking companies lock in their fuel costs for five years, which would provide a total savings of $120,000 over the life of the contract.

Discussion questions:

1. Why is LNG a supply chain topic in operations?

2. What major US shippers have announced plans to convert to LNG-powered fleets?

OM in the News: Productivity Increases Are Driving the Trucking Industry

Average distance travelled by trucks is declining because of increased productivity

The road ahead for the nation’s 18-wheelers is shrinking, reports The Wall Street Journal (March 21, 2013), as rising fuel, driver and equipment costs have led shippers to devise ways to operate more efficiently. Truckers are driving fewer miles, allowing operators to squeeze more years out of vehicles already on the road and lessening the need to buy new trucks or expand fleets. While railroads have taken some freight from long-distance truckers, greater productivity is having a bigger impact. Lighter weight and smaller packages, better routing and fewer empty trucks on the road have affected productivity. Last year, the average distance traveled by tractor-trailers in the U.S. fell to 110,614 miles, a 12% decline from the late 1990s.

“We’ve been working through a period of super-productivity gains in trucking,” says the president of ACT Research. “Everybody has been trying to take costs out of transportation. If your productivity is strong enough, you don’t need a lot of new trucks.”

Hillyard Inc., for example, a Missouri cleaning products manufacturer, clocked 2.8 million miles of driving last year with its 21 trucks. But less than 10% of those miles were with empty trailers, compared with 25% four years ago. Increased use of smart phones has improved Hillyard’s ability to locate drivers on the road and dispatch them on the fly to pickup and delivery sites. “Nobody makes money sitting still,” says the firm’s transportation manager. “We’re doing more work with the same amount of trucks.”

This leaves truck makers pinning their hopes on more fuel-efficient vehicles to stimulate replacement demand. A loaded tractor-trailer typically uses a gallon of fuel every 5-6.5 miles. Getting just 1 mpg more saves thousands of dollars a year on the fuel cost for a single truck. Cummins and Peterbilt are developing a new model getting 10 mpg, using a high-efficiency engine and a more aerodynamic trailer and cab that reduce wind drag.

Discussion questions:

1. Using Equations (1-1) and (1-2) in Chapter 1, what are the productivity factors (inputs and outputs) in this story?

2. Why is productivity in trucking such an important OM issue?

OM in the News: Calculus for Truckers

As a former math major, it was hard to skip over the article by this title in Forbes (Sept. 12,2011) which describes the multimillion dollar simulation software created by Schneider National to manage its massive trucking business. With 13,000 drivers, 10,050 trucks on the road at any one time, and over 33,000 trailers waiting to be hauled, this 76-year old, $3.1 billion company faces many daily decisions regarding scheduling of drivers and equipment. For example, drivers are on the road between 4 days and 3 weeks at a time, and then must be back home by a certain date. The government regulates driver breaks and hours per day at the wheel (11 max). And customers are only open during certain hours.

Prior to hiring Princeton prof Warren Powell to build its fleet-wide “tactical planning simulator” (which is actually based on dynamic programming algorithms), Schneider relied on pilot projects to answer key logistical questions. A group of, say 20, drivers was carved out, experimented with, and results were drawn–at a cost of $100,000’s each time. But too often a system that worked well on the small sample did not scale well for the whole company. Sometimes the pilot even cost more than the money saved with the policy change.

The simulation model works like this: it runs forward in time 3 weeks to set the value of having a truck and driver at a certain location at a certain time. Then it runs backward in time to the “present”, reconciling the results with those that happened in the simulated future. It runs forward 3 weeks again and then backward, continuing to improve its estimate. When the schedule “converges” after hundreds of thousands of  decisions, the process is complete. Schneider has saved tens of millions of dollars with the new system, which not only schedules, but helps determine price hikes, hiring patterns, and fleet size.

Discussion questions:

1. What other aspects of OM can Schneider use the simulator to analyze?

2. Why is simulation such a valuable tool in OM?