Guest Post: Southwest Airlines’ Boarding Overhaul–When Queuing Theory Takes Flight


Providence College Professor Jon Jackson discusses a topic that every flier understands.

For over 50 years, Southwest Airlines has stood out with its open seating policy—passengers lined up, boarded in order, and picked any available seat. That system will soon end. Starting in January, Southwest will introduce assigned seating and its first premium seats, as part of a major redesign of its boarding process. Internally called “Project USA,” this initiative is more than a marketing shift—it’s a deep operational rethink based on one principle: if queuing isn’t good, boarding isn’t good.

Southwest’s new boarding plan is a live experiment in queuing theory and process design, balancing efficiency with customer experience. Boarding is a significant driver of turnaround time—a key metric for airlines. Every minute saved at the gate means higher aircraft utilization, lower fuel costs, and better schedule reliability, writes The Wall Street Journal (Oct 13, 2025).

Astrophysicist Jason Steffen’s boarding process, which boards passengers in a diagonal pattern, minimizes blocking and maximizes parallel activity. Simulations suggest it could reduce boarding times by 30–50%, but it relies on strict compliance and passenger discipline—hard to guarantee in practice.

Southwest’s new system will use a variation of the WILMA method—boarding Window, then Middle, then Aisle seats—to reduce aisle interference and speed up boarding. This approach is validated by queuing research, though the Steffen process is even more efficient in theory.

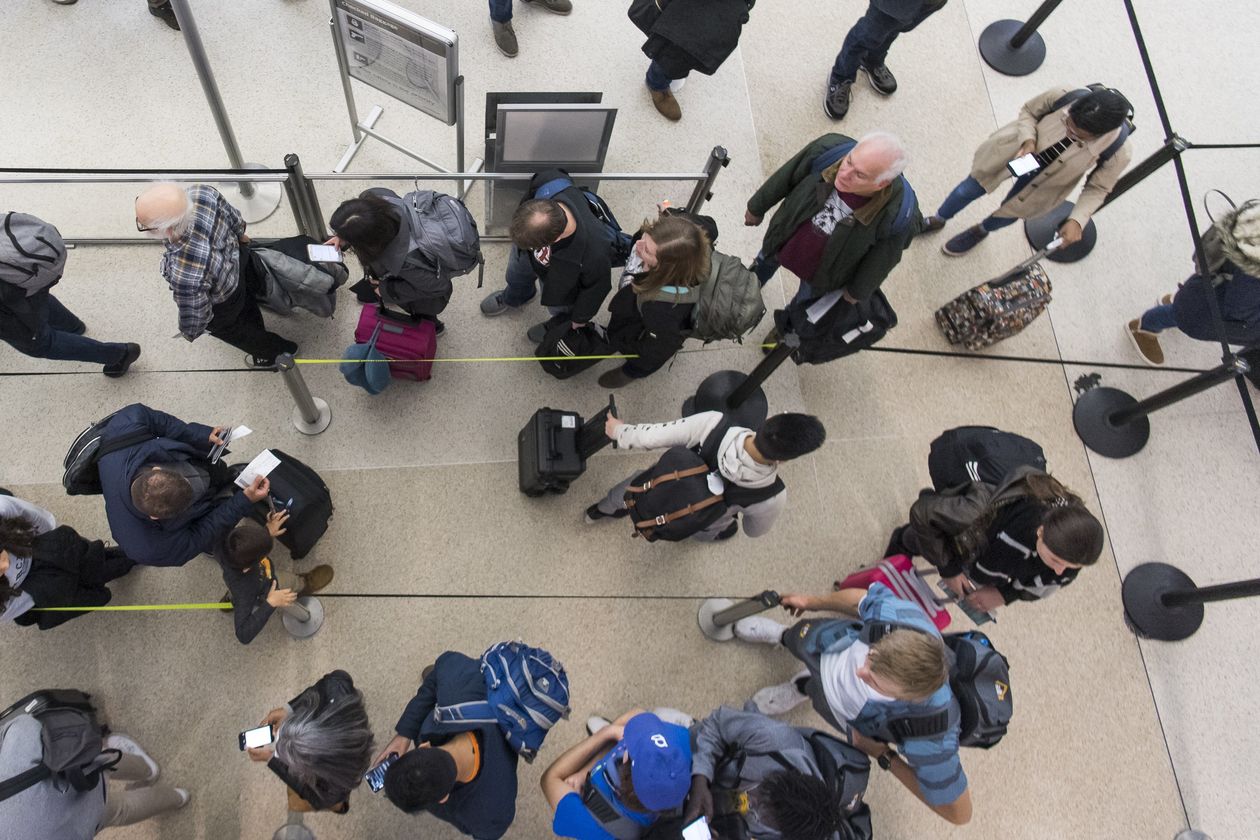
Boarding an aircraft is fundamentally a queuing problem—a test of bottlenecks, flow efficiency, and human behavior. The new plan introduces nine boarding groups and two parallel lines to create a smoother, more predictable flow.

Classroom Discussion Questions
1. How do the WILMA and Steffen boarding processes differ in terms of efficiency, complexity, and customer experience? Why might Southwest choose a simplified version rather than the most efficient theoretical model?
2. What behavioral factors might reduce the effectiveness of Southwest’s new boarding plan, and how could the airline design around them?

Guest Post: Rethinking Queuing Theory in the Age of Virtual Lines

Jon Jackson,  Associate Professor of Operations Management at Providence College, raises an interesting issue regarding waiting lines. 

Queuing theory emerged in the early 20th century with the rise of telephone systems and has since become a core part of operations management education. Classic models like M/M/1 and Little’s Law—staples of Module D: Waiting-Line Models—help us analyze everything from grocery checkouts to airport security.

But in recent years, a shift has occurred, one that challenges our assumptions about what a “line” even is. Increasingly, companies are replacing physical queues with virtual ones. Customers now “get in line” via app or text, receive real-time updates, and arrive just in time for
service. Disney’s Virtual Queue and Yelp’s Waitlist are a well-known examples, but virtual queues are also popping up in healthcare (e.g., Canadian ERs) and government services (e.g., North Carolina DMVs).

From a customer-experience perspective, virtual queuing offers obvious benefits: more flexibility, reduced perceived waiting time, and greater comfort. But from an operational lens, it raises a deeper question: are we still managing a queue, or managing something entirely new?

At first glance, queues—physical or virtual—follow the same logic: customers arrive, wait, and are served. But virtual systems change how that waiting is experienced. In physical lines, customers can see how many people are ahead, assess progress, and make real-time decisions about balking or reneging. In virtual lines, those cues disappear.

Virtual queues also alter arrival rates. Traditional models assume random arrivals and FIFO service. But virtual systems can shape arrival patterns via notifications and estimated wait times. This introduces a hybrid between queuing and appointment systems.

Fairness and prioritization are evolving too. In physical lines, order is usually determined by arrival time. In virtual systems, paid priority (e.g., Disney Lightning Lane) complicates this logic.

Should we optimize for efficiency or fairness—or both? Even foundational concepts like Little’s Law may need rethinking. If a customer isn’t physically present, are they still “in” the system? Ultimately, virtual queuing is more than a customer-experience improvement. It’s a meaningful shift that invites us to revisit historical queuing models and the assumptions behind them.

Classroom Discussion Questions:
1. In a virtual queue, does a customer “enter the system” when he joins the queue virtually or when he physically arrives for service? How does your answer influence how we analyze the system?
2. How does paid priority—whether in virtual or physical queues—impact perceived fairness?

Guest Post: Reducing Waiting in Mass Transit

Prof. Howard Weiss shares his insights with our readers monthly.

A recent article in the Philadelphia Inquirer noted that SEPTA, the transit authority for Philadelphia and its suburbs, “is shopping for a contractor to build a new fare collection system with more convenient payment options.”

Work on the current SEPTA fare system began in 2011, and like many projects, the system was delivered two years late in 2016 and at nearly double its original $122 million budget. While the fare system is only 7 years old, it was almost obsolete when it was delivered because riders could not purchase their tickets or fare cards from home as they can for transit systems in several cities. Of course, purchasing at home or by app saves time when traveling by not having to wait in line at a kiosk to buy a ticket or put money on a fare card. It also reduces the probability of missing a train because you are stuck in line.

Several cities go a step further to improve transit times. You do not even need to go through a turnstile or wait for a bus driver to check your ticket. These cities use an honor system that relies on riders to purchase their tickets. This reduces boarding times and lines for busses and waiting times on the subways. Also, passengers can board busses using any door not just the front door which reduces the boarding time. There are controllers who may check tickets and if the rider does not have one the rider is fined – for example, $60 in Hamburg, Germany, $150 in Copenhagen, or $250 in Los Angeles.

Roads, Bridges and Tunnels
Thirty-five states have toll roads, bridges or tunnels. Many of these have been allowing drivers to use the web to upload money to their passes since their inception. In addition, some toll areas have express lanes for EZ pass drivers making collection times faster than driving through a toll booth. Some roadways have implemented toll by plate where rather than staffing a toll booth a picture is taken of a license plate and a bill is sent to the driver by mail if the car did not have a transponder for the system.

Roughly half of the toll collection locations in the U.S. collect tolls in only one direction rather than both directions. Obviously, this reduces waiting time in the toll-less direction.

Classroom discussion questions:
1. What is the downside to the toll collection agency using one-way tolling?

2. What are the disadvantages of operating a toll by plate system?


Guest Post: Fast Food Restaurants

Prof. Howard Weiss shares his insights with our readers monthly. We all spend time in fast food restaurants, so today’s topic should be of broad interest.

There are nearly 200,000 fast food restaurants, also known as quick serve restaurants (QSR), in the U.S. Obviously a key to these restaurants is short waits and fast service. Module D of your Heizer/Render/Munson textbook lists important measures for waiting line situations including:

 Average time that each customer spends in the queue
 Average queue length
 Average time that each customer spends in the system (waiting time plus service time)
 Average number of customers in the system

These measures have been increasing at many QSRs. However, the increase is not due to reduced productivity but rather to changes that have occurred in QSRs over the past several years. One change is that menus at fast food restaurants have expanded to include meals that take more time to prepare. The first fast food restaurant was White Castle, which opened in 1921 and had a very limited menu with only four items – a slider hamburger (which cost 5 cents), Coca Cola, coffee and apple pie. Today, QSRs have much more varied menus. Another reason that service times take longer is that patrons are becoming more sophisticated in placing custom orders, which take more time to prepare.

Recently, there has been an increase in the number of patrons who use the drive-thru lane. Much of this increase is due to COVID. All fast food restaurants reported an increase in 2021 of drive thru traffic with the percentage of patrons using drive-thrus being reported as 37% in one report and 52% in another. Because more customers are using drive-thrus the number of customers in line increases and therefore so does the waiting time.

There are steps fast food restaurants have taken to reduce the customer time in the system. Many have installed kiosks inside the restaurant so that ordering and payment is self-service. Just as ATMs increase the service capacity in a bank these kiosks increase the capacity at fast food restaurants. Another step is encouraging mobile ordering and payment so that the order will be ready when the customer arrives to pick it up. Some updated restaurant designs have increased the number of drive thru lanes.

Classroom discussion questions:
1. How have apps and kiosks changed how you receive service at QSRs?
2. What could be the downsides of QSRs using apps or kiosks?

Teaching Tip: The Vaccination Assembly Line

The Orange County Convention Center, here in Orlando, is a massive and magnificent building.  At 7 million square feet (something like 146 football fields over 22 acres), it is the second largest facility of its kind in the U.S. The main exhibit hall alone seats 139, 857 people, enough to easily handle conventions such as MegaCon (68,940 in attendance), NCAA Volleyball Championships (72,000), and Design Week (85,000). But during COVID, the Center has largely sat empty, as tourism and its 125,000 related jobs in Orlando have declined dramatically.

But alas. The Convention Center has a new purpose. Its underground unloading area has been turned into a COVID-19 vaccination drive-thru assembly line! Here is an interesting example of a service assembly line (Ch.9) and a multichannel, multiphase queuing system (Module D) that you can share with your students. I just went through the system this week and was impressed by the operations planning and execution.

Work Station 1: Outside the building, a single channel queue greets you, with the server checking the bar code on your cell phone to be sure you are eligible to enter.

Work Station 2: Inside the building, the medical team scans your barcode again, takes your temperature, and attaches a barcode sticker to your arm. You drive forward 10 yards.

Work Station 3: Your arm barcode sticker is scanned and you are asked a series of medical questions. The brand of shot you will receive is announced (no choice) and you are provided informational material. You drive forward 10 yards to parallel Bays A, B, or C as directed.

Work Station 4: Your arm barcode is scanned again, you get the shot, with band aid applied. You are told to exit the building and wait in your car in the adjacent lot to see if there is a negative side effect. You are to honk your horn if you are ill.

Work Station 5: You sit in the lot for 15 minutes.

Work Station 6: You are scanned again as you exit the property and asked if you had any side effects. You never leave your car.

Total time in system, including 15 minutes in parking lot, is 25 minutes.

Classroom discussion questions:

  1. Clearly the system is efficient, but can it be made more so?

2. Can it be easily replicated in every city?

OM in the News: The Queue Returns

With social-distancing measures in place for the foreseeable future, queue management—our topic in Module D—is being recast as a health-and-wellness hero. “The design practices and software tools that line experts have been working on for years might become as common as the queues they manage”, writes The Atlantic (Oct.28, 2020).

Disney is thought to have invented the “switchback queue” (that snakes back and forth) during the 1964 World Fair in NYC. Guests stopped complaining about the long queues at the Disney attractions, even if the lines hadn’t actually gone down. Over the next decades, the company perfected the waiting experience with props and preshows designed to entertain but also distract its guests from the endless waiting. In 1999, Disney’s FastPass allowed guests to pick their battles by skipping lines that weren’t worth the wait. Ever since, having fewer people in queues and more roaming the park has been the name of the game.

Queues of shoppers maintaining distance against coronavirus outside a market in Piura, Peru

Distractions give human minds pause. But designers and engineers still have not figured out how to vanquish long lines. In a pandemic, frivolous distractions won’t cut it. The people who waited for 5 hours today to cast a ballot don’t need distractions from the wait; they need measures that will keep them safe and, better yet, allow them to avoid waiting in the first place. (On average, people overestimate how long they’ve waited in a line by about 36% by the way. This means that the actual wait time, no matter how short, isn’t the main problem; it’s is how long people feel they’ve been waiting).

WaitTime, a creator of crowd-intelligence-software designed for stadiums, uses ceiling-mounted cameras, computer vision, and patented AI to interpret crowd conditions in real time, so published wait times are always up to date. 

New fear of proximity could spell the end of the physical line. Eight months into the pandemic, make-do solutions such as tape markers and DIY signs are giving way to more deliberate strategies such as magnetic queuing grids, virtual lines, and timed-entry passes.

Classroom discussion questions:

  1. Why do queues depend on cultural/social habits?
  2. What measures can be used to force people to stand 6 feet apart?

OM in the News: Do You Hate Waiting in Line?

Conventional wisdom says that the fastest-moving line is a single “pooled” line. We have long subscribed to this mathematical approach with Models A and B in Module D, Waiting Line Models in our OM text. But a new study, reported in The Wall Street Journal (Oct, 26, 2020), just found that splitting the pool into individual lines made them move faster.

The researchers looked at patient wait times and length of stay in the ER of a California hospital. They found that when the hospital switched from a pooled line to a dedicated-queue system in which patients were assigned to a specific doctor, average wait times decreased 9% ( by 39 minutes) and lengths of stay decreased 17%.

Single lines may not be the fastest in knowledge-intensive fields.

With a dedicated-queue system, physicians could see who they were helping, who in the waiting room had been assigned to them and exactly how long their individual queue was. The doctors seemed to feel more ownership when they could see which and how many patients were assigned to them.

But would service providers in other industries behave the same way as? The study concluded that a dedicated queue would also speed up wait times in fields that are knowledge-intensive and have high levels of customer ownership, such as medicine, personal banking or places like the Apple Genius Bar.

“The phenomenon is not expected to translate to anonymous call centers or other settings where the service provider doesn’t have a relationship with the customer or the service is very routine, like at a grocery checkout or a factory with machines,” says one of the researchers in a forthcoming article in the journal Operations Research. “Companies may want to look at their organizational culture, seeing where there is room to encourage more customer ownership, and consider ways to change to a dedicated-queue configuration to achieve shorter wait times. Encouraging customer ownership by dedicating assignments to each server when planning queue configurations might shorten the wait and service time.”

Classroom discussion questions:

  1. Explain the difference between Models A (M/M/1) and B (M/M/s).
  2. What model is being described in this study?

OM in the News: The High Cost of Long ER Waits

Crowded emergency rooms have long been a problem in the U.S., writes The Wall Street Journal (June 9, 2020),  In our discussions of queuing theory in Module D, we typically focus on the many attributes of the waiting line–length, time, cost–and on occasion we add the cost of adding multiple servers. However, a recent study by a S. Carolina prof shows that when a new ER opens, crowding at nearby facilities instantly falls an average of 10%. When comparing mortality rates at the older ERs before and after the change, the research found that a 10% drop in patient volume leads to a 24% reduction in mortality rates in the first 30 days and a 17% reduction over 6 months.

In ERs across the U.S., many patients wait for hours to be seen, and about one in 50 leaves before receiving treatment. ER patients awaiting admission to the hospital often have to wait in hallways on gurneys, while ambulances may be turned away from busy facilities. Researchers have long sought to quantify these costs of crowding.

The drop in mortality rates could be attributed to fewer people leaving against medical advice. Ten percent less patients in the ER reduced the number of patients walking out by about 51%. That is important because about 46% of people who leave the ER without being seen still need immediate medical attention. In fact, 11% are hospitalized in the next week. Since patients often come back for care soon after they leave, that could help explain why the drop in mortality rate was most significant in the first 30 days.

The study also examined whether the drop in patent volume affected “boarding”—that is, when patients wait on stretchers, sometimes for hours, before being admitted into the hospital. But patients from the ER tend to generate less profit and consequently often have to wait anyways for beds, so the study concluded that boarding is not impacted by ER crowds.

Classroom discussion questions:

  1. Why is this study important?
  2. What OM issues are faced on a daily basis in ERs?

Guest Post: Waiting Lines and the Coronavirus

Our Guest Post today comes from Howard Weiss, Professor of Operations Management Emeritus at Temple University.

A couple of thoughts have come to my mind recently with respect to the coronavirus.

As more citizens become infected with a virus, fewer citizens are available to become infected. This is identical in principle to the arrival rate in a finite population waiting line system. Consider, Example D7 from your Heizer/Render/Munson textbook. There are 5 printers that each break down at the rate of .05 per hour. Thus, if all five computers are working, the system arrival rate is 5*.05=.25 while if all 5 are broken down the system arrival rate is 0. Over time, the arrival rate changes depending on the number of printers that are working and we can compute the weighted average arrival rate, which we term the effective arrival rate. The Excel worksheet for this example, available on MyOMLab, computes the effective arrival rate as .218 printers per hour. This effective arrival rate is similar to the effective reproductive number that epidemiologists use for viruses.

Data Results
Arrival rate (l) per customer 0.05 Average server utilization(r) 0.436048
Service rate (m) 0.5 Average number of customers in the queue(Lq) 0.203474
Number of servers 1 Average number of customers in the system(Ls) 0.639522
Population size (N) 5 Average waiting time in the queue(Wq) 0.933264
Average time in the system(Ws) 2.933264
Probability (% of time) system is empty (P0) 0.563952
Effective arrival rate 0.218024


An interesting graphic related to the virus spread is at this Washington Post web site.

Observation: I recently had the opportunity to attend a concert at the Amalie Arena in Tampa. At intermission, the men’s room had a long line. This is not unusual. However, the line was not for the urinals or stalls but rather for the sinks. This was unusual. The design of the bathrooms was clearly for normal use rather than for a situation like the one we currently have with increased demand for handwashing. I was wondering what an arena might do to handle the increased sink demand.

OM in the News: Let Slower Passengers Board Airplanes First

Physicists demonstrated that there really is an optimal boarding process for airplanes.

Commercial airlines often prioritize boarding for passengers traveling with small children, or for those who need extra assistance—in other words, those likely to be slower to stow their bags and take their seats—before starting to board the faster passengers. It’s counter-intuitive, but it turns out that letting slower passengers board first actually results in a more efficient process and less time before takeoff, according to new research in ARS Technica (Jan. 15, 2020).

Physicists have been puzzling over this particular optimization problem for several years now. While passengers all have reserved seats, they arrive at the gate in arbitrary order, and over the years, airlines have tried any number of boarding strategies to make the process as efficient and timely as possible. Flight delays have a ripple effect on the complex interconnected network of air travel and often result in extra costs and disgruntled passengers.

The new study found it’s actually 28% more efficient to let slower passengers board first. As boarding progresses, those at the tail-end of the slow group will still be getting settled as the first influx of fast people begins boarding. For instance, 3 or 4 fast people might take their seats in the time it takes a single slow person near the back of the aircraft to sit down. Having all the fast people board first means the last fast passenger is already seated before the first slow passenger gets settled.

To illustrate, use the well-known analogy of trying to pack rocks and sand in a jar. Put the sand in first and there won’t be much room left for the rocks. Put the larger rocks in first, and you can then pour in plenty of sand to fill in all the gaps around the rocks. “That’s the lesson of this latest result,” said one of the researchers. “If you’re going to pour a bunch of passengers into a vessel like this, and you’re dividing them up into slow people versus fast people, it’s better to get the slow people out of the way first and then let the fast people trickle in.”

Classroom discussion questions:

  1. What other approaches have airlines attempted to speed boarding?
  2.  What process analysis tools discussed in Ch.7 of your Heizer/Render/Munson text do you think could be used to tackle this problem?


OM in the News: Kroger Thrives on OM Innovation

Kroger was able to decrease average check-out wait times from 4 minutes to 30 seconds with no additional labor.

Back in 1883 when Barney Kroger invested his life savings of $372 to start his first store, the second purchase he made was a horse and carriage so he could deliver goods to his customers. One could make the argument that Barney knew the importance of delivery before Domino’s, Amazon or Blue Apron ever existed. OM innovation has long been a tradition at Kroger, writes ORMS Today (Dec., 2017). In the early part of the 20th century, Kroger was the first grocery store to introduce self-shopping and the first to surround its stores with parking lots. It became the first company to test electronic scanners in the 1970s, and in the 1990s, one of the first with self-checkouts. Now, with 2,800 stores, Kroger serves 9 million customers a day. Here are just 2 of its latest OM advances:

Kroger developed the industry’s first real-time solution for queueing to answer the question, “What if we could open another lane the moment queueing conditions required it?” Simulation models led to a system of sensors above each entrance and register that measures the number of customers walking into stores, as well as the number of customers standing in line at each lane. Combined with a real-time POS feed, Kroger is able to make predictions on the number of customers arriving at the front end by day of week and time of day. The system tells managers on a big screen hanging above the registers how many lanes are open, how many lanes should be open now, and how many should be open in 30 minutes, in order to proactively meet the rush of customers about to arrive.

Its inventory control model, Pharmacy Inventory Optimization, helps set Min/Max re-order points for the ordering system, reducing annual out-of-stocks by 1.7 million prescriptions, labor ordering costs by $10 million, and annual inventory costs by $120 million, while increasing sales by $80 million. It was a finalist for the INFORMS Franz Edelman award.

Classroom discussion questions:

  1. How has OM helped Kroger become an innovator?
  2. Where else can OM tools be used to increase productivity in a supermarket?

OM in the News: The Psychology of Standing in Line on Black Friday

“Standing in line is a pain. At the post office. At the box office. At a restaurant. But on Black Friday, it’s an experience,” writes The New York Times (Nov. 24, 2017). The first spot outside some Best Buy stores is usually claimed weeks in advance, often by a person in a tent. Shoppers at Walmart will print out maps of the store, with circles around their primary targets. Someone, somewhere, will try to cut in line at a Target, arousing the wrath of the cold, cranky people who played it fair.

“These queues are quite different from the usual annoying ones we encounter day-to-day at the A.T.M. or in the subway,” said MIT prof Richard Larson. “People’s willingness to wait is, in some sense, proportional to the perceived value of whatever they’re waiting to acquire. Even if they don’t know what the line is for, they reason that whatever’s at the end of it must be fantastically valuable.”

Lines test patience, personal space and principles of fairness and rationality, especially on Black Friday, when the crowds can be overwhelming. Still, the promise of a once-a-year score lures hordes of shoppers to queues that start before sunrise.

Queuing theory examines why lining up by yourself induces more anxiety than being in a group, why choosing between multiple lines is more aggravating than standing single file and even how music and scent can improve the wait. Black Friday’s preordained opening hours mean that the time the line should start moving is predictable, which can sometimes cause customers to become more agitated as the end approaches. In 2008, a crowd of more than 2,000 shoppers waiting at Walmart store on Long Island began pounding on the glass doors a few minutes before the scheduled 5 a.m. opening time. The doors shattered and shoppers stampeded through, fatally trampling a worker.

Classroom discussion questions:

  1. How many of your students participated in the Black Friday queues?
  2. Is queueing theory more mathematical or psychological?

OM in the News: Why Hospital ER Wait Times Are Often Wrong

Driving down the highway, you’ve undoubtedly seen a new kind of digital sign advertising local hospitals. “Current wait 5 minutes,” they say, with the wait time updating in real time to reflect the current conditions in the ER. It’s an effective form of advertising, and it gives consumers a sense of transparency about making the choice to go to the ER. Yet if you head to that nearest ER, don’t be surprised if you end up waiting longer than the sign says. “The truth behind these numbers is that they’re often wrong,” according to Insights by Stanford Business (Aug., 2017). Looking at the ERs of 4 LA hospitals and testing the effectiveness of the method for estimating wait times, the study by Stanford U. professors found the method extremely unreliable in all cases–off by as much as 1.5 hours. Drawing on queuing theory, a new model, Q-Lasso, was able to cut the margin of error by as much as 33%.

The trouble with most wait time estimates is that the models these systems use are often oversimplified compared to the complicated reality on the ground. One of the most common ways of arriving at a wait time estimate is to simply give a rolling average of the time it took for the last few patients to be seen. This works well if every patient is the same, they arrive at a steady rate, and all of their ailments take the same amount of time to diagnose and remedy. But that’s rarely the case in the real world.

So the researchers came up with a large number of potential factors to look at. Q-Lasso would then select the best of them from the data. For example, it was initially assumed that the number of nurses working would be an important criterion for assessing wait time. But the data showed this was mostly irrelevant. Q-Lasso could provide wrong times, but the model tended to overestimate wait times, rather than underestimate them, making the experience more acceptable.

Classroom discussion questions:

  1. Why are advertised wait times often wrong?
  2. Describe the Q-Lasso model.

OM in the News: Why You Shouldn’t Walk on Escalators

It’s more efficient if everyone stands on an escalator instead of some people walking on it

The train pulls into the station, the doors open and you make a beeline for the escalators. You stick to the left and walk up the stairs, figuring you can save precious seconds and get a bit of exercise. But you’re doing it wrong, seizing an advantage at the expense of other commuters. Boarding an escalator 2-by-2 and standing side by side is the better approach, says The New York Times (April 5, 2017)  and it is more efficient if nobody walks on the escalator.

The question of standing versus walking flared up recently in Washington, D.C. after the Metro said the practice of walking on the left could damage the escalator. The escalator company Otis said this is not true, but passengers should not walk on escalators, as a matter of safety.

The Metro is not the first mass transit operator to try to address this issue. Last year, the London Underground tried to change passengers’ behaviors and get them to stand side-by-side riding — not walking. The Underground had concluded that in very tall stations, much of the left side went unused, causing blockages and lines at the bottom. It campaigned to fill the available space on the escalators with people, rather than leaving the left side of each step largely empty, except for those who chose to hike up. It found that standing on both sides of an escalator reduced congestion by about 30%. Walking up the escalator took 26 seconds compared with standing, which took 40 seconds. However, the “time in system” — or how long it took to stand in line to reach an escalator then ride it — dropped sharply when everyone stood.

When 40% of the people walked, the average time for standers was 138 seconds and 46 seconds for walkers. When everyone stood, the average time fell to 59 seconds. For walkers, that meant losing 13 seconds but for standers, it was a 79-second improvement. The length of the line to reach and step onto an escalator dropped to 24 people from 73.

Classroom discussion questions:

  1. Will this happen in the U.S?
  2. Explain the concept of “time in system”?

Video Tip and OM in the News: Why the Other Line Always Moves Faster

wsj-queueQueuing (see Business Analytics Module D) is always a popular topic with students–and evidently with readers of the Wall Street Journal (Oct. 7, 2016) as well. This Journal article is a very basic tutorial on the history (Erlang discussion) and logic of waiting line modeling.

The piece writes: “You’ve probably participated in this familiar dance: Given a choice of checkout lines, you’ve somehow picked the slowest. You could wait it out. You could chassé to another queue. Or you could bail out altogether. After all, no one likes to wait. But are the other lines really faster? When parallel lines feed multiple cashiers, you may not be in the slowest one, but chances are, you also are not in the fastest.”

 Prof. Bill Hammack, at the U. of Illinois (YouTube’s “Engineer Guy”), explains it like this in his 4-minute video: “Imagine three lines feeding three cash registers. Some shoppers will have more items than others, or there may be a delay for something like a price check. The rate of service in the different lines will tend to vary. If the delays are random, there are six ways three lines could be ordered from fastest to slowest—1-2-3, 1-3-2, 2-1-3, 2-3-1, 3-1-2 or 3-2-1. Any one of the three (including the one you picked) is quickest in only two of the permutations, or one-third of the time.”
Classroom discussion questions:
1. Why doesn’t every service provider use the multiple-server, single line approach?
2. Explain Erlang’s theory.