OM in the News: How Technology Helps Kroger Reduce Queues

QueVision monitors tell how many lanes need to be open now and in 30 min.

Supermarket giant Kroger, reports The Wall Street Journal (May 2, 2013), is winning the war against lengthy checkout lines with a powerful weapon: infrared cameras long used by the military and law-enforcement to track people. These cameras, which detect body heat, sit at the entrances and above cash registers at most of Kroger’s roughly 2,400 stores. Paired with in-house software that determines the number of lanes that need to be open, the technology has reduced the customer’s average wait time to 26 seconds. That compares with an average of four minutes before Kroger began installing the cameras in 2010.

Reducing wait times is becoming a top priority for retailers, from high-end department stores to hardware chains to fast-food outlets. Battling both online rivals that offer at-home convenience and intensifying competition among fellow brick-and-mortar outlets, many companies see enhancing the shopping experience as a way to build loyalty. Kroger’s system, dubbed QueVision, is now in about 95% of its stores. The system includes software developed by Kroger’s IT department that predicts for each store how long those customers spend shopping based on the day and time. The system determines the number of lanes that need to be open in 30-minute increments, and displays the information on monitors above the lanes so supervisors can deploy cashiers accordingly.

The company says surveys show customer perception of its checkout speed has improved markedly since 2010. “The bottom line is we want our checkout experience to be the best, and it’s our goal that our customers will enjoy the experience so much that they’ll want to return,” says Kroger’s senior VP.

Discussion questions:

1. What other new technologies are being used in service industries to speed up checkout lines (see the WSJ article and Chapter 7)?

2. How can QueVision help boost orders?

Guest Post: A Teaching Tip for Visualizing Waiting Line Flows and Interarrival Times

steve harrodWhile Jay and Barry attend the INFORMS meeting in San Antonio, Dr. Steven Harrod, Assistant Professor of Operations Management at the University of Dayton provides this, his 5th Guest Post for our blog.

I find in teaching Waiting Line Models in Module D of the Heizer/Render text that the definitions and relationship of rates of flow and inter-arrival times are frustratingly difficult for some students to grasp. Here is a classroom exercise that may help:

Introduce the following video (http://youtu.be/O84FlZnP0qs ), explaining that it shows traffic starting after a red light turns to green. Start the video at 0:17 (prepare the video in advance so you don’t have to watch the commercial during lecture). Draw the students’ attention to the second lane of traffic, headed by the Range Rover.

Explain that this flow of traffic may be described either by how many cars cross the white stop line in a period of time, or by how long each car takes to cross the line. Either way, the traffic flow described is identical. Play the video, and count ten cars across the line (ignore the car that changes lanes). Car number ten is a yellow cab, so stop the video with the eleventh car at the white line. You should find the video counter at 0:42, or 25 elapsed seconds. This is a flow of 10 cars in 25 seconds, or 10/25 cars per second, or 1440 cars per hour.

Restart the video at 0:17. Now, count the seconds between each successive car at the white line. They are, approximately, 5, 3, 2, 1, 3, 2, 2, 3, 2, and 2. The average time between cars is then 2.5 seconds. Now, since in both cases we have witnessed the same traffic flow, make the argument that these two measurements are equivalent. Indeed they are, after you explain that the inter-arrival time of a flow and the rate of flow are inverses of each other. In this case in particular, (1/2.5) = (10/25) and [1/(10/25)] = 2.5.

For some students, this is a difficult concept, and I  repeat this approach multiple times in the course.

OM in the News: Eliminating the Waiting Line at Hotel Check-In

Concierge registering guest at Andaz West Hollywood

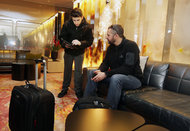
Hotels are changing the way guests check in to their rooms, writes The New York Times ( March 19, 2013), eliminating the traditional stop at the front desk to speed up, simplify and personalize the process. When guests arrive at citizenM, a boutique European hotel chain, they check in at a kiosk and go straight up to their rooms. The kiosk was designed to be easy to use because most travelers are encountering it for the first time.

“The hospitality industry is moving toward more automated check-in systems,” says NCR’s VP for kiosk systems. “Customers are used to A.T.M.’s at the bank instead of tellers, checking in for airplane flights online, and they are now looking for that same efficiency when they arrive at a hotel. No one wants to wait in line for the front desk anymore”.

Automated hotel check-in is expected to expand rapidly. In a typical system, guests check in by computer or phone before they arrive and enter their expected arrival time, which helps the housekeeping staff with the room cleaning schedule. A bar code is sent to the traveler to print out or display on his or her phone. At the hotel, the guest scans the bar code at a kiosk. The machine assigns a room and spits out the number of plastic key cards requested, and the guest can head upstairs.

Hotels are also using new technologies to eliminate the front desk check-in line — with personal greeters who shepherd guests through the check-in process in a more comfortable setting. Andaz West Hollywood has combined its front desk staff, bellmen and concierge functions into “hosts,” who greet guests as they enter the lobby and sit with them on comfortable couches to check in using an iPad with a credit card reader.

This article is a nice complement to the Winter Park Hotel case study in Module D.

Discussion questions:

1. What is the benefit to hotels in implementing kiosk check-in?

2. Will these systems be widespread in a few years?

Guest Post: Teaching Inter-Arrival Times in Queuing Models

steve harrodDr. Steven Harrod is Assistant Professor of Operations Management at the University of Dayton and can be reached at steven.harrod@udayton.edu. Here is a link to his syllabus.

The single greatest challenge in teaching queuing in Module D of the Heizer/Render text is getting students to comprehend the difference between inter arrival and rate of flow. There is something deeply psychological and subconscious about this. Students frequently skim over the text and do not distinguish between the two expressions. Here is an in class exercise to practice this concept:
For each scenario in the table below, ask students to calculate the inter-arrival time and the flow rate (with answers shown in the right columns). Clearly state the unit of time measure for each answer. Each description refers to a random flow.

Inter-Arrival=time/(arrival count)       Flow, λ=(arrival count)/time=1/inter-arrivalSrteve Harrod mod. D graphic

Description

Inter-Arrival

λ

The ticket taker at the roller coaster   collected 45 tickets in 3 hours.

4 m

15/h

Cars arrive at the car wash once every 3   minutes.

3 m

20/h

Customers arrive at McDonald’s at the rate of   100 per hour.

0.6 m

100/h

Customers were recorded entering the store at   12:05, 12:07, 12:15, 12:22; 12:30: 12:31, 12:33, 12:40, and 12:50.

5 m

12/h

Fifteen passengers arrived for the 1 pm bus,   then twenty-five passengers arrived for the 2 pm bus, and then ten passengers   arrived for the 3 pm bus.

3.6 m

16.66    /h

Good OM Reading: Analytics at Disney World

Here in the tourist mecca of Orlando, Disney World reigns as king. With 60,000 employees (called “cast members”), Disney is a driving force not just in our economy, but in the use of operations management tools. Analytics (Sept.-Oct. 2012) has a great piece on the careful planning guests don’t see taking place “behind the scenes” to run the operation smoothly. The article examines the role analytics plays in ensuring the guest experience is maximized. It makes a nice supplement to our text coverage of Disney in both the forecasting (Ch.4) and waiting line (Module D) chapters.

The authors write: “Forecasting serves as the analytical foundation for operations planning at the Resort. It all starts with the park attendance forecast, which lays out the expected attendance at each park. These predictions are strongly considered when setting park hours and performing other strategic planning. More granular forecasts are required for each individual area, such as guest arrivals at the hotel front desks. The company recently launched a new labor demand planning system, which generates forecasts for every 15-minute period at many locations throughout the property, including park entry turnstiles, quick-service restaurants and merchandise locations. These forecasts help the resort plan labor effectively to ensure guest service standards are met”.

Another innovative way the resort uses forecasting is for attraction wait times. The most popular attractions use Disney’s FASTPASS system – a unique virtual queueing system that allows guests to receive a ticket with a designated 1-hour window of time when they can return and skip the regular line. From a central command center underneath the Magic Kingdom, forecasting models are executed every 5-10 minutes to project the return patterns of FASTPASS guests based on entertainment schedules and the number of FASTPASS tickets that have been distributed. The forecasts are posted at the front of the attractions to help guests choose whether to enter the line, take a FASTPASS ticket or return to the attraction later in the day. These wait times are also available on Disney’s Mobile Magic smart phone app, which shares real-time information about the parks throughout the day.

I think your students may also enjoy reading this down-to-earth article.

OM in the News: Queuing Up at Heathrow

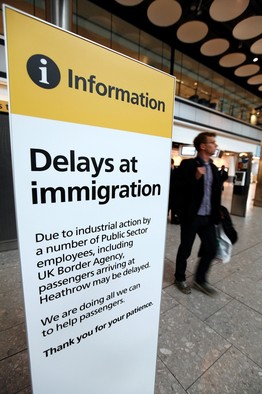
The great unknown for international travel: How long will I have to wait at immigration when I arrive? At Bangkok’s airport, it can be 2 hours. At New York’s JFK,  its 23 minutes at 3 am, but 37 minutes at 5 am.  And at London’s Heathrow,  25% of non-EEU passengers wait more than 45 minutes. (Heathrow’s target that 95% of passengers  clear with 45 minutes was breached at least 107 times during the 1st 2 weeks in April).

The Wall Street Journal (May 5-6, 2012) reports that the biggest cause of long delays is that arriving flights aren’t spaced out evenly, and that there aren’t always enough border agents to process long lines when arrivals are clumped together. “It’s simply a matter of a saturated queue, and you solve that with either more servers or shorter processing time,” says Carnegie Mellon’s Prof. Alfred Blumstein.

Since shorter processing times could mean less attention paid to security checks to keep illegal migrants or terrorists from crossing borders, airports need to add more agents to minimize wait times. Part of the challenge with staffing, of course, is that demand for passport checks varies widely throughout the day.  “We know at times queues have been too long,” says a Heathrow spokesman. He said the agency is adding 80 agents at peak times, and 480 during this summer’s Olympics.

With budgets tight, however, expanding the workforce can be difficult. Prof. Blumstein, for example, who waited for over an hour at Heathrow two weeks ago, suggested moving people sooner from the main queue into shorter lines before each desk to “shorten the dead time.” As we teach in Module D, however, if the person already at the desk takes longer than average to clear, this can increase the overall average time in queue. That can lead to frustration if others who were further behind in the queue get served first.

Discussion questions:

1. Identify which queuing model Heathrow uses now.

2. How can you improve on Blumstein’s suggestion?

Good OM Reading: Analytics–The Widening Divide

Why don’t more managers embrace the business analytic tools we use in so many aspects of our OM courses?  A new report by MIT Sloan Management Review (Nov.8, 2011) answers the question with a survey of 4,500 executives regarding the integration of analytics in their enterprises. The report,  Analytics: The Widening Divide,  concludes that cultural biases, such as the need for new management competencies and organizational resistance to new ideas –more than technological hurdles–are the primary barriers.

First, a definition of business analytics: “the use of statistical, quantitative, predictive, and other models to drive fact-based planning, decisions, execution, management, measurement, and learning. Analytics may be descriptive, predictive. or prescriptive”.

The MIT Sloan report breaks companies down into 3 categories: Transformed (heavy users), Experienced (moderate users), and Aspirational (companies least experienced in the use of business analytics). The good news is that the number of firms in the 1st two categories, who use analytics for competitive advantage, has surged by 57% in the past year. The Aspirational group’s use of analytics actually declined by 5%. Transformed organizations have set the pace in expanding use of analytics and were found to be 2.2 times more likely to substantially outperform industry peers.

The Transformed group keenly appreciates the value of precise and real-time decisions, and is 3 times more likely to focus on speed of decision-making than Aspirational firms. This means managing operations and improving output levels based on real-time supply and demand management. Inventory replenishment processes, for example, are automated and production is optimized in these companies. As a case study, the report follows McKesson, which processes 2 million hospital orders per day. McKesson does so by embedding algorithms into customer orders to manage the inventory process without human intervention.

When students ask you why analytics are important in your OM course, this report provides a ready response.

OM in the News: Service Quality at MGM Grand–the World’s Largest Hotel

The Wall Street Journal’s (Sept.22, 2011) headline, “When 12,000 Guests Spend the Night”, makes a great lead-in for teaching quality in Chapter 6. With 5,043 guest rooms in towers overlooking the famous Las Vegas strip and an occupancy rate of 96.8%, how can such a mega property counter perceptions that it’s just too big to give good service?  The strategy, at every point–from parking lots to check-ins to housekeeping–is to make its operations feel small. It’s not easy to do with a driveway entrance that’s 14 lanes wide, where the lobby has 100’s of people waiting to check-in,where 70,000 people enter the doors every day (for the hotel, casino, restaurants, shows, meetings)–all in an aging 18 year-old hotel building.

One of MGM’s techniques for service quality is to judge execs on how well their staff meet quality standards. Room service must be delivered within 30 minutes of an order (and there are 1,000 orders/day!), maintenance calls must be answered in 15 minutes  (by a staff of 186 engineering employees with mobile carts), a car must be retrieved by a valet in 8 minutes (not easy when the parking lot holds 9,487 cars!), and the 370 housekeepers must clean each room in 30 minutes.

To cut the perception that check-in queues are too long (for years guests stood in 2 long snaking lines), the MGM now has 36 small lines, one in front of each front-desk worker. “There’s the perception”, says the front desk manager,” that they’re going to get through quickly”. This makes a nice teaching point in Module D (Waiting Line Models), since it contradicts the mathematics of  a single queue with multiple servers.

To cut lines further, lobby greeters with iPads abound, giving directions and doing check-outs. New ID scanners download names and addresses from drivers licenses and passports so employees don’t have to type in the data–shaving time off each check-in.

Discussion questions:

1. How does the hotel help a guest who can’t find his car in the parking lot?

2. What other technologies can be used to make the MGM operations more efficient?

Teaching Tip: Helping Your OM Students Find Jobs with Business Analytics

Just a day or two ago, I got a nice email from our colleague Barry Spraggins, who is Chair of the Managerial Sciences Department at the University of Nevada-Reno.  Barry uses our text Operations Management, 10th ed.,  and noted that he teaches heavily from all the Quantitative Modules, including Decision Making Tools (Module A), LP (Mod. B), Transportation (Mod.C), Queuing (Mod.D), Learning Curves (Mod.E), and Simulation (Mod.F). He writes: “I still think these are relevant components”. Not by coincidence, we find that The Wall Street Journal (Aug. 4,2011), Jay and I,  and IBM all agree.

The Journal reports that finding qualified graduates in business analytics has proven difficult–and colleges are finally stepping up to meet industry demand. IBM, which spent more than $14 billion since 2005 to buy a flock of analytics companies, has now teamed up with over 200 colleges to develop analytics courses. Fordham and Indiana U. are unveiling analytics curricula, as well as certificate and degree programs. Indiana, for example, is offering certificate programs in business analytics to both Deloitte and Booz Allen employees. Fordam has a required course called Marketing Analytics for MBAs. U. of Virginia, also working with IBM, is introducing an analytics track this fall.

“Analytics is certainly one of the top five things executives are worried about and investing in heavily”, says the president of Teradata. “Industry is going to demand it. Students are going to demand it”. As IBM and other big firms drive the software implementation process to the board room, we in academia may very well see a resurgence of demand for the very topics Prof. Spraggins has long espoused. In a tough job market, this is one way to help our students gain competitive advantage.

OM in the News: The $1,000,000,000 Queue

The newspaper in your town probably doesn’t run its lead story about queues and wait times. But this is Orlando, and when Disney World (with its 62,000 local employees) announces a $1 billion program to improve wait times with “interactive queues”, it is the headline (Orlando Sentinel, March 26,2011)!  Queues alone consume 10-20% of Disney’s capital budget.

Queues are a delicate balance at all of Disney’s theme parks, especially at Magic Kingdom, which hosts more than 45,000 visitors daily. Guests paying $85 to get in have long complained about the lines as their #1 beef. “Where are you going to put all those bodies? Well, some of them have to be in a queue”, says a UCF prof.

Here are some of the ways Disney’s “Next Generation Experience” project is spending its massive budget: interactive queues at Space Mountain, Winnie the Pooh, Haunted Mansion, and Epcot’s Soarin’. After 40 years of slowly shuffling towards the Haunted Mansion, for example, waiting riders now move through a graveyard filled with elaborate crypts. When you touch the tomb of a composer, instruments carved in the stone play music.

Disney has always paid attention to ride queues, with lavishly themed “pre-shows” that help establish the attraction’s story line.  Disney added giant video screens in the Soarin’ queue, equipped with sensors that allows big groups of guests to play collaborative games while waiting. Now it has placed 87 video-game stations in the Space Mountain queue and play areas for kids in the Winnie the Pooh line.

“Guests were willing to wait 12% longer because of the interactive experience”, says a Disney exec. That’s about 7 min. in an hour-long line. (To read our 2 earlier blogs about Disney and queues, click here).

Discussion questions:

1. Disney’s “NextGen” will also let guests book ride times from home and by-pass lines entirely. Is this a good OM idea?

2. Why is Disney willing to spend $1 billion to make its lines more fun?

OM in the News: Queuing Up For Quick McDonald’s Medicine

McDonald’s medicine it’s called: patients in the US want their health care like their food–served up speedily and made “your way”. ” The prospect of waiting for health care is not only distasteful to Americans;  its downright threatening”, say the  MD authors of the recent Time (Jan. 26,2011) article. The mere specter of Canadian-style waiting  lists for tests and procedures evokes enough fear to challenge the concept of government subsidized health care, they add.

We have blogged about waiting for medical care earlier and it’s clear that convenience has become an important part of the way people think. CVS  drug stores offer walk-in “Minute Clinics”, many ERs have billboards advertising guaranteed wait times (offering free movie tickets if they run longer), while other hospitals have even experimented with drive-thru ERs!

The real question is whether it is feasible to implement a reasonable waiting time for “urgent” conditions—like heart attacks, strokes, and lung infections. The good news is that convenient care clinics do a good job of handling coughs, colds, a swollen knee, and even a nagging hernia that hurts a bit more than usual today. But the root problem may be that the current system of medical care  is not set up to triage acute health needs.

This is where OM can help. So many of the issues tied to creating more efficient heath care can be tackled by re-engineering, process analysis, layout changes, JIT, lean,and all the other topics we teach in OM. You can click on Mark Graban’s Lean Blog to see his excellent discussions.

Discussion questions:

1. Why do we need to reorganize ER treatment centers?

2. What is the difference between “severity” and “urgency” in selecting a treatment?

3. How can OM help shorten ER queues?

OM in the News: Disney and the Art of Queuing

On Thanksgiving, I  blogged  that our family spent a day (mostly in queues) at Disney World, here in Orlando. My report was from the perspective of a customer being entertained while in lines and touring the park.

Now the New York Times (Dec.28, 2010) presents the inside view of the same theme park, but from the underground control room. This nerve center sits below the Cinderella Castle and has made the art of queuing into a science.

“There has been a cultural shift towards impatience–fed by video games and smart phones”, says a park manager. Customers are simply demanding more action. One response:  at Space Mountain, 87 game stations now line the queue to keep visitors entertained. Each provides 90 seconds of  game challenges.

The operations center monitors all 40 rides at Magic Kingdom, and because of its efforts, the average park visitor can now ride 10 of them (up from 9) in a typical day. For example, if a control center light monitoring the Pirates of the Caribbean ride changes from green to yellow, the operations manager can launch more boats…. or may dispatch Capt. John Sparrow or Goofy to entertain people in line. If Fantasyland  is swamped, but Tomorrowland less crowded, the ops center can relocate a miniparade to siphon guests in that direction.

Discussion questions:

1. Why does Disney expend such effort on queue management?

2. What other approaches could be attempted to shorten waits?

OM in the News: If You Don’t Get Your Bag in 20 Minutes, You Get $20!

We have seen it in the ERs…”we guarantee you will be seen in 30 min. or….”. But did we ever think we would see it in airports as we wait for our checked bags? After decades of mishandled and delayed suitcases arriving to the carousel (which costs the airlines $2.5 billion a year), the quality of service is finally improving dramatically—all because of OM efforts.

The Wall Street Journal (Dec.2,2010) reports that Alaska Airlines has just implemented a 20 min. guarantee. If a customer’s bag does not arrive at the claim area within 20 min. of arrival, fliers get a $20 voucher or 2,000 frequent-flier miles. Alaska has improved its misdirected baggage claims by 52% in the past 2 years. For all airlines the  lost luggage figures are down by a whopping 38%. “If you are going to charge for bags, you better be really reliable”, says US Airways’ COO.

How did OM impact the change? New technology  and revised processes (both in Ch.7) are the keys. Airlines have ramped up use of bar-code scanners to track bags along their journey–something cargo shippers and supermarkets have been doing for years. Delta invested $100 million in its Atlanta operations alone. It gutted the entire infrastructure under Terminal B to make room for an automated baggage system. Belt time is 7-10 min., vs. the old system of driving bags on carts, which took 15-30 min. Payback comes from less mishandled bags, which average $100 each.

Alaska Airlines has changed its processes and a new strict adherence to timeliness. Within 10 min. of arrival, all bags must be offloaded. And instead of measuring when the 1st bag hit the carousel, Alaska tracks when the last bag is delivered, posting scorecards for employees. “It is measuring and setting goals that are very specific”, says the airline.

Discussion questions:

1. Why and how did airlines improve so quickly?

2. What technology drives the changes?

3. What do students think of the 20 min. guarantee?  Will other carriers be forced to match it?

Teaching Tip: Queuing Up at Disney on Thanksgiving

Having lived in the Orlando area for over 2 decades, everyone assumes my family and I are regular visitors to the Magic Kingdom and the 5 other  Disney World properties here. After all, Disney World is a powerhouse,with over 62,000 local employees (called “cast members”)  and 48 million visitors last year. So when they find I have yet to take my 13 year old son to the Magic Kingdom, I appear to be some sort of ogre. (To my defense, my kids have been to Universal, Sea World, Wet n’ Wild, Blizzard Beach, Animal Kingdom, and on and on). To overcome this pressure, we all went to Disney today, Thanksgiving, 2010.

Here is what we learned. Thanksgiving is one of the  busiest days of the year. And Disney has a clear plan for dealing with this capacity situation (Supp.7): All free passes are cancelled, all cast members are called in, extra parades are scheduled, more refreshment booths are opened, and hours are extended…the Park didn’t close till 1am!

But the queues–oh the queues! Where else would a rational family of 4 pay $340 in entrance fees, $12 to park, and $50 for water and ice cream, only to wait in a series of 45 minute lines for 5 or 6 rides and shows…and then walk away happy as can be?

Here is the secret to the psychology of queuing theory…something Disney’s flock of Ph.D.s in OR and IE have mastered: (1) Keep your customers informed of how long each queue will take,with signs posted frequently…and overestimate, don’t underestimate. (2) Entertain them while they wait, with videos, music, and cartoon characters. (3) Keep the lines moving so progress seems to be taking place. And (4), make people walk long distances between the most popular features, with plenty of interesting activities en route.

I hope this leads to some useful class discussions about how how queues can be managed. Happy Thanksgiving to all!

OM in the News: Waiting Lines in the Doctor’s Office

My internist of many years, Dr. Gulden, never ceased to amaze me before he retired. For every scheduled appointment, I was seen within 5 minutes of my arrival!  This led to research I did in 1994, when I found that the average wait time in doctors’ offices in the US was 20.6 minutes, costing about $15 billion per year in lost productivity.

I guess this topic was of interest since the finding made the front page of papers around the country, from the Boston Globe to the Miami Herald.  Yesterday, The Wall Street Journal (Oct.19,2010), with the headline “The Doctor Will See You Eventually“, announced that the “average  time patients spend  waiting to see a health care professional is now 22 minutes, and some waits stretch for hours”. Are any of us who teach OM shocked?

This is a great article to discuss when you cover waiting line models in Module D. But it may also be useful in Supp.7, Capacity and Constraint Management, because the Journal   talks about cutting cycle time. In one doctor’s office, patients helped measure their times from arrival until departure. By identifying bottlenecks, the doctor was able to cut 12 minutes from the typical 40 minute stay.

So why was Dr. Gulden so successful in keeping on-schedule? I think there was  one main reason: he made all his staff  understand that each patient’s time was as valuable as his was.

Discussion questions:

1. Ask your students to rank the seven methods the article discusses in terms of  what they think are the best for time savings payoff.

2. Many hospitals now advertise their ER wait times. What have they done to improve their process flows?

3.What kind of queuing models can be used in a doctor’s office?