Guest Post: Teaching OM Using a Smart Pen

Wende BrownDr. Wende Huehn-Brown is Professor of Business at St. Petersburg College. Her earlier Guest Post describes her blended learning course. 

I am constantly trying to integrate evolving technology in my entirely online classes to help students with the learning objectives.  I further provide these online resources to blended students as reference materials for additional help on study plan and homework submissions they need to complete outside of class.  A couple of years ago my husband gave me a smart pen for Christmas– the Echo LiveScribe pen (see http://www.livescribe.com/en-us/smartpen/echo/). At first, I found learning to use and sharing the output in my online classes a challenge. But in the past year LiveScribe seemed to resolve this issue with an Adobe format which makes it much easier (see example  Problem 1.9 ).

This past fall I started adding pencast tutorials like this example to my Operations Management course using select Study Plan problems.  I had viewed similar tutorials others developed for math classes and thought it might be helpful for my students in operations management.  I typically find my students really struggle with the analytics in this field.  At this point I have a small sample size, and I further complicated my data collection and analysis for comparison purposes by changing homework requirements (actually added further work to better align with another university for articulation).  While making the homework more challenging, the overall average grade went from a C to a B since I developed 31 pencasts!  Students tell me they can replay these pencasts multiple times to help the analytical concepts ‘sink in’.  I also have 24 other video tutorials showing students how to use POM for Windows or Excel OM to solve similar study plan problems.  Yet students tell me “the pencasts helped the most” in their feedback.

Wende can be reached at huehnbrown.wende@spcollege.edu.

Guest Post: Jazzing Up Your OM Syllabus

Howard WeissOur Guest Post today comes from Prof. Howard Weiss, at Temple University. Howard is the developer of the POM for Windows and Excel OM problem solving software that we provide free with our OM texts.

When I began teaching in 1975 I would write my syllabus by hand and my secretary would type it on mimeograph paper for duplication and distribution to students. The mimeograph morphed to Xerox, and in the 1980s I began to type my own syllabus using my PC. When the internet became available I stopped reproducing the syllabus and had the students download it for themselves. I kept the syllabus black and white since many students did not have a color printer.

At this point, color printing is available to all of my students, either at home or in our computer labs. This allows me to include graphics (eg, Labor day, Halloween) on my syllabus in order to make it more engaging.

wordleMore recently I have begun to add a word cloud to my syllabus. A word cloud is a visual representation of the content of a document or web site. The size of the font of the words in the word cloud is proportional to the number of times the word appears in the document or web site. This enables viewers to very easily pick out the more important terms and concepts in the document.

Wordle.net is a web site that enables users to very easily create their own Word clouds. I have taken my course syllabus, modified it some, and used wordle.net to create the word cloud (shown here) that I have included on my syllabus. Wordle gives the user the opportunity to customize the cloud by selecting the font, the colors, the layout (horizontal, vertical, mixed), and the maximum number of words in the cloud. The word cloud improves the appearance of my syllabus and it gives a sign to the students that I am current in that I use the recently developed word cloud representation.

Another use: When a colleague retired recently, we took his resume, imported it into Wordle and gave him an 18” by 24” framed picture of his resume’s word cloud–a very unique, highly appreciated gift.

Guest Post: Teaching OM Online at FSU

Jeff-SmithDr. Jeff Smith provides today’s Guest Post. Jeff is Associate Professor of Operations Management at Florida State University

While moving to an online format enables colleges to reach a whole new segment of students, it also presents new challenges, especially true for those who teach courses such as OM.  The good news, however, is that we are getting much closer to the ability to simulate the actual classroom experience given the different technological platforms that are now available.  In contrast, the challenges of the virtual environment are still daunting and require a new perspective.  I view the challenges along 3 broad dimensions.

The 1st is comprehensiveness and contingency planning.  You simply have to think a little more outside the box on this front.  Specifically, you need to think of every possible way that something can fail and try to put in controls to account for that.  As an example, I teach students in locations that span the globe so you need to be crystal clear on all dates and times as this will establish the baseline for all course activities.  Beyond that, there are always technological issues that cause problems.

The 2nd component is time commitment and information processing.  When teaching on campus, you know exactly what days/times you will meet so you can plan your work load around that.  In the online environment, this is simply not the case since you will often have students working around the clock–and they expect you to be doing the same. Online classes also often are larger, so the total amount of individual communication you have to process is exponentially larger.  The overall time commitment can be 2-3  times more intense in this setting.  I have found that the best way to handle the added information is to ‘batch’ all the requests and select 2 distinct times per day to sit and respond to all the requests.

The final challenge is that you have to be much more creative in getting information to your students.  A live class enables you to explain something via an inter-personal exchange. The online environment does not allow for this.  For example, for a given topic, I try to supply a power point lecture to accompany each chapter in the Heizer-Render text.  I will also find videos, popular press mentions, and websites to add more support to what I am covering.  Finally, I pre-record lecture snippets aimed at adding clarification to the more difficult topics or for working through specific example problems. (I use Tegrity and record these as 15-20 minute clips that can be downloaded to different devices by each student).

Guest Post: A Pareto Exercise Using M&M’s

Today’s Guest Post comes from Coleman R. Rich, who is Chair of Elon University’s  Marketing and Entrepreneurship Department. Coleman is also  Senior Lecturer in Operations and Supply Chain Management.

I used many quality tools in the textile industry before coming to academia and I wanted to create an exercise where students could understand the use of two common tools, the check sheet and the Pareto chart.

Here are the items needed:  Blank check sheet, Graph paper, paper plates, and a 1.69 oz bag of M&M’s for each student.

Instructions:  I tell the students they are finished goods inspectors and each color of M&M is a defect.  They are to count the number of defects using tick marks and record that information on their check sheet.  Then they are to rank each color from high number of occurrences to the lowest number of occurrences and calculate the cumulative percent.  From this information, draw a Pareto Chart of the colors on the graph paper and correctly label the chart.

Discussion:  After the exercise, I call on students to tell me the number of blue, green, orange, etc. defects in their bag and the total number of M&M’s in their bag.  I record this information on the board for the class to see the randomness of the different colors in each bag.  I focus on the total number of M&M’s in each bag which you’ll see will vary between 63 and 57 M&M’s per bag.  This leads to a discussion of variation and SPC.  I also discuss what is Critical to Quality to the manufacturer and the Consumer.  Finally I have the students visually inspect the M&M’s for chips, cracks, shapes, etc.,  and ask why the Mars company doesn’t try to create a perfect M&M.  I think you know the answer to that.

Dr. Matt Valle, Professor of Management, here at Elon University has taken this exercise a step further using other quality tools in our paper, “Quality Tools for Project Management:  A Classroom Exercise” to be published in Business Education Innovation Journal, Vol. 4, No. 2, December 2012.


Guest Post: Using “Clickers” at U. Tennessee to Draw in OM Students

This Guest Post comes from Dr. Bogdan Bichescu, Assistant Professor of Management Science in the University of Tennessee’s College of Business Administration. Bogdan teaches very large OM classes and has blogged for us before about his experiences in that environment.

Attempting to improve student participation, this semester I decided to tie grade curving to class attendance and participation in my large introductory operations class. I suggested that students who attend classes and participate regularly would receive a bonus of up to 1% of their final grade. To avoid the operational challenges of collecting and grading paper attendance quizzes typical of large classes, I decided to experiment with personal response systems, i.e., “clickers”. More than 80% of the students enrolled already had a clicker registered on their name. The rest could sign up for an online account and participate via smartphones, tablets, or laptops for a small fee.

Initially intended for tracking attendance, the clickers have gradually evolved into a mechanism for evaluating content retention and promoting student engagement. I was compelled to rethink my approach to class delivery and plan more carefully for student engagement. I include clicker questions throughout my class notes to engage students at several points during class. I sometimes include questions from homework assignments or from exams. I encourage students to work in groups to answer clicker questions and I may re-poll the students on a certain concept or technique that is particularly challenging. I give credit for incorrect answers and include questions that ask for students’ opinions.

While clickers have not resulted in higher class attendance (due to the small grade contribution), I feel that classes are now more fun and engaging. The questions have generated more animated discussions, student competition (I can track which major, or group has better attendance or scores; students often go “yeah!” when they answer correctly a difficult question), and a somewhat better exam performance for the more active students (but more data analysis is needed). Student feedback has been positive and I am thus encouraged to use clickers in the future, potentially increasing the contribution of clicker questions and quizzes to about 10% -15% of the final grade.

Guest Post: Using POM for Windows’ Powerful Normal Distribution Calculator

Our Guest Post today comes from Prof. Howard Weiss, at Temple University. Howard is the developer of the superb POM for Windows and Excel OM problem solving software that we provide free with our OM texts.

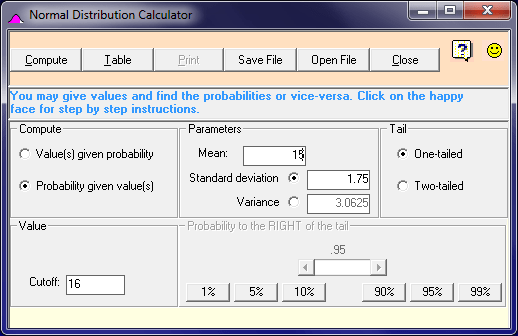
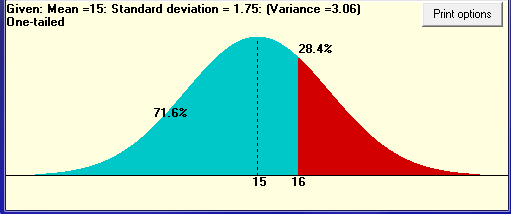
One of the very useful features of POM for Windows is a Normal Distribution Calculator. This tool makes these computations much easier than using a calculator. It is also more meaningful for your students than using Excel because of the graph that is presented. The Normal Distribution Calculator can be found in the Tools menu in POM or on the toolbar and is useful for solving problems in the Project Management, Forecasting, Quality Control and Inventory (safety stock) chapters.  Example 10 from Chapter 3, Project Management, is displayed below.

The students indicate the type of problem – compute a probability as in this example or find cutoff values given a probability, enter the mean and standard deviation, indicate whether the problem is one or two-tailed,  and either give the cutoff(s) or give the probability. POM displays a very readable, meaningful curve which enables the students to quickly identify the answer.

Guest Post: Using Excel “Active Models” at St. Ambrose U.

Our Guest Post today comes from Prof. Rick Jerz at St. Ambrose University, in Davenport, Iowa. The video series he has created is terrific and we encourage you to look it over.

Many students who do not seem to like OM feel that way because they struggle with the mathematical models.  In my courses, I take a different approach.  I use the Heizer/Render text’s Excel Active Models to teach and reinforce modeling techniques and math.  Realistically, business students are typically not going to develop math models. But they might take the models and create more user-friendly ones by using a powerful business tool like Excel.  So why not introduce students to this approach in your course?

For many professors, modeling with Excel can be time demanding.  I encourage you to look at these Active Models provided by the authors. If you give them some time, you will see that they work fine in your class.

One challenge is how to teach students how to use these models.  I  solved this problem by creating my own instructional videos.  The videos give me time to teach the model and provide some tips about using Excel.  The Excel models, combined with my videos, became a great learning environment for students.  Instead of students dreading the OM course, they actually enjoy it and appreciate that they are learning more ways to use Excel creatively in business.  (See some student comments at http://www.rjerz.com/c/opsmgt/MSCI3000/Students/OM-Excel-Student_Comments.pdf)

By the way, these Active Models are “active” because they use scroll bars to quickly change data and observe a graphic dynamically changing.  This might be the best and easiest way to teach sensitivity analysis. I have found that this approach pulls together the many pieces of OM: concepts, mathematics, modeling, sensitivity analysis, and decision-making.

Here is a link to some examples of my lecture videos http://www.rjerz.com/v/rjPlayer/rjPlayer.html?crs=omexamples&vid=2&vids=1,2,3,4, as seen with my “Flash” player.  If you want to move these examples to iTunes and your iPhone/iPod/iPad, here is the feed URL (http://www.rjerz.com/c/opsmgt/Podcasts/OMU-Examples.xml)  that you should copy, then paste into iTunes (Advance|Subscribe to Podcast.)

Judge for yourself.  Watch my videos!

Guest Post: Four Tips for Teaching Large (and Small) OM Classes

 Our Guest post today comes from two experts in the science of teaching. Wilbert McKeachie,  Professor Emeritus at University of Michigan, has served as President of both the American Psychological Assoc. and the American Assoc. for Higher Education. Marilla Svinicki is a Professor at University of Texas-Austin.

Many of us who teach today are being tasked with doing more with less. This can reach to the classroom and result in larger sections as more students are allowed to enroll in each. Large classes are also nothing new for many first- or second-year survey or pre-major courses in business schools. No matter the reason for the larger class size, students may exhibit a tendency to hold back their responses — or their attention — in a large lecture hall. Thus, to combat a tendency towards passivity among students, it’s vital to have a strategy for keeping them actively engaged during each class session.

In our book McKeachie’s Teaching Tips (2011), we offer a number of suggestions for maintaining student interest, involvement, and attention:

• Invite faculty members or student teams to debate relevant topics during class. This interchange of ideas offers students an opportunity to practice their listening and critical-thinking skills in a lively setting.
• Conduct an interview with another colleague or outside expert who can present a different perspective on the material you’re addressing.
• Assign a student presentation. In addition to encouraging independent thinking and individual motivation, the activity can also enable students to learn from one another and gain valuable experience working as part of a team.
• If time is too tight for each individual student to present, consider a “poster session.” Working in groups, students conduct research on a given topic, and then present their findings . Students stand by the posters in shifts, ready to answer questions about their work, while also taking time to circulate and review their peers’ posters.

Though you probably won’t substitute all your lectures for these activities, they can certainly serve to break up a sense of routine — and keep students on their toes!

Guest Post: The Distribution Game– A Perfect Class Engagement Activity

Our Guest Post today comes from Dr. Chuck Munson, who is  Professor of Operations Management at Washington State University.

It’s not always easy to find an activity that combines true learning with fun and competition. For more than 15 years I have been successfully using “The Distribution Game” in undergraduate supply chain management and MBA operations classes. The game was originally designed by Peter Jackson and John Muckstadt at Cornell http://people.orie.cornell.edu/~jackson/distgame.html, and it can still be downloaded for free (although it may require a modern platform conversion).

Each day for 200 days, the player must choose how many units to order for three retail locations and the supplying warehouse (so this is a multi-level inventory problem). It takes 15 days for the product to reach the warehouse from the supplier and 5 days to reach the stores from the warehouse. Demand is random. The animation is a little bit crude by today’s standards, but it’s still quite effective to see little trucks carrying products across the screen each day.

I like the game because it can be played whether or not inventory formulas have been taught. Students can try to use common sense and some can perform quite well doing so; nevertheless, they seldom beat my performance that’s completely formula-driven. Imbedded in the game are issues of safety stock, balancing setup and holding costs, lead time effects, and lumpy demand at the warehouse. We can usually get through about four games during an hour in the computer lab or with laptops in class.

Game parameters can change: I vary the demand distribution, relative holding and setup costs, and lead times. For me, the most important learning outcomes are: (1) equalize total holding and setup costs, (2) the warehouse should order in integer multiples of the combined retailer order sizes, and (3) the pipeline should be empty when time runs out.

Have fun, and consider awarding prizes to the winners!

Guest Post: How I Teach Forecasting at Temple U.

Professor Howard Weiss at Temple University’s Fox School of Business writes about how he uses software to teach forecasting. Howard, the developer of both Excel OM and POM for Windows,  is also Academic Director of  Temple’s EMBA program.

For several years, I have been assigning my students a forecasting project using data from their company.  Since I want students to learn about seasonality, I require the data  must be four complete cycles of the measurement. That is, I ask for 48 months, 16 quarters, 20 or 28 days, or 8 or 24 hours over 4 days. Most students are able to obtain data from their company and for those who cannot I ask them to find acceptable data on the web or ask a classmate for data.

I have the students  first present three graphs: a graph of the data over 48 months, a graph of the annual data over the 4 years, and a stacked graph of the data over 12 months for each of the 4 years. For the first two graphs, I have them apply Excel’s easy-to-use option to identify the trend line. I also ask the students to identify the ratio of the trends. They expect annual to monthly trend to be near 12, and are surprised when it is closer to 144. I have the  students use the stacked graph to identify seasonality.

I then require the students to run their data through most of the models in the Heizer-Render textbook. Using POM for Windows (which comes free with the book), it is very easy to change from model to model, to determine the best n for moving averages and the best alpha for exponential smoothing. It also is straightforward to run the decomposition methods that are in POM, which will determine seasonal factors as in the textbook.  For each model, students are to identify the bias, MAD, MSE, standard error, and MAPE –and select the best forecasting method based on the error measures. Finally, using the method they have selected, I ask them to identify forecasts for the next 12 months and the seasonal factors for each month.

The students very much like applying forecasting to data from their own company. They  also appreciate the value of the graphs, the ease in changing from one method to another in POM, and that the different methods will yield different results.

Guest Post: Student Assessment with a Twist At Texas Tech…EIP (Effort Impact Points)

Our Guest Post today comes from Phillip Flamm, who teaches OM in the ISQS Department in the  Rawls College  of Business at Texas Tech University. This is his 7th Guest Post. Phillip can be reached at pflamm@ttu.edu.

I’ve often wondered exactly how learning and effort are connected. I know that good student effort usually leads to better grades, but up to this point I have only utilized personal response system “clickers” in my Operations Management class as a reward for effort. During the first summer session of 2012 I attempted to expand the boundaries of effort measurement by combining several factors as a reward system that would be based on student effort. Those factors are:

  1. Total number of lectures attended (measured by PRS responses)
  2. % improvement from Exam 1 to Exam 2
  3. Number of focus groups attended (a student led collaborative learning session held the day of each lecture)
  4. Seeking writing help from the campus Writing Center for the written version of the team project.

With the help of Jason Triche, a PhD student who is team teaching with me, we developed a 5 tiered reward scale based on an accumulation of effort points (EIP) earned for each activity. The reward system looks like this (800 total points for the course):

  • Tier 1: Range – 15 to 20 (EIP) receives a 3% addition to semester total (24 points)
  • Tier 2: Range – 12 to 14 (EIP) receives a 2%  ……………(16 points)
  • Tier 3: Range – 9 to 11 (EIP) receives a 1% ………………(8 points)
  • Tier 4: Range – 5 to 8 (EIP) receives a .50% …………… (4 points)
  • Tier 5: Range – 0 to 4 (EIP) receives 0%.

We have just begun to analyze the data but it appears that approximately 20% of the students receiving EIP actually moved up a letter grade as a result. So, it appears that their effort was rewarded with extra credit and higher exam scores.

Guest Post: Certifying Supply Chain Resiliency

Our guest post today comes from Prof. Matt Liotine in the Dept. of Information and Decision Sciences, University  of Illinois-Chicago. Jay and I had the privilege of lecturing in his MBA classes during the POMS Meeting in Chicago in April.

Supply chain resilience has taken center stage in recent years amidst the many adverse events that are taking place across the globe. We have seen first hand how tsunami, earthquakes, hurricanes, tornadoes, wildfires, volcanoes and other natural disasters can not only cause loss of life and asset damage, but can also disrupt business operations. While is it incumbent upon companies to establish business continuity and disaster recovery plans to continue their operations in light of such events, it is also necessary for them to evaluate or even audit such plans pertaining to their key suppliers.

Several standards have been issued across the globe that businesses can use in this regard, such as ISO 22301, BS 25999 (U.K.), and NFPA 1600 (U.S.), and ASIS SPC.1. Most recently, the U.S. Congress has mandated a voluntary program of accreditation and certification of private entities for business continuity. Called the Voluntary Private Sector Preparedness Accreditation and Certification Program (PS‑Prep), this initiative was an outgrowth of the 9/11 Commission Act of 2007. Companies can use any of the last three standards cited above as a compliance benchmark since these share many similar principles and characteristics. Compliance is evaluated by auditors representing a PS-Prep certifying body. The U.S. Department of Homeland Security has authorized that these bodies be accredited by the ANSI-ASQ National Accreditation Board. While totally voluntary, PS-Prep can provide a mechanism for companies to evaluate and certify their own business continuance as well as that of their suppliers. (AT&T has been the first company to become PS-Prep certified.)

It is important to note that such compliance is not only targeted towards large corporations, but also for small-to-mid size businesses, which in fact constitute a significant portion of the global supply chain. While it may be infeasible for smaller suppliers to acquire a certification, buyers can still encourage or even enforce good business continuance practices by their suppliers through either contract stipulations and/or business processes.

Guest Post: Supply Chain Resilience–a Visualized Introduction

Ben Benjabutr, at http://www.SCM-Operations.com, in Thailand, provides an interesting guest post in his Powerpoint explanation of supply chain resilience.
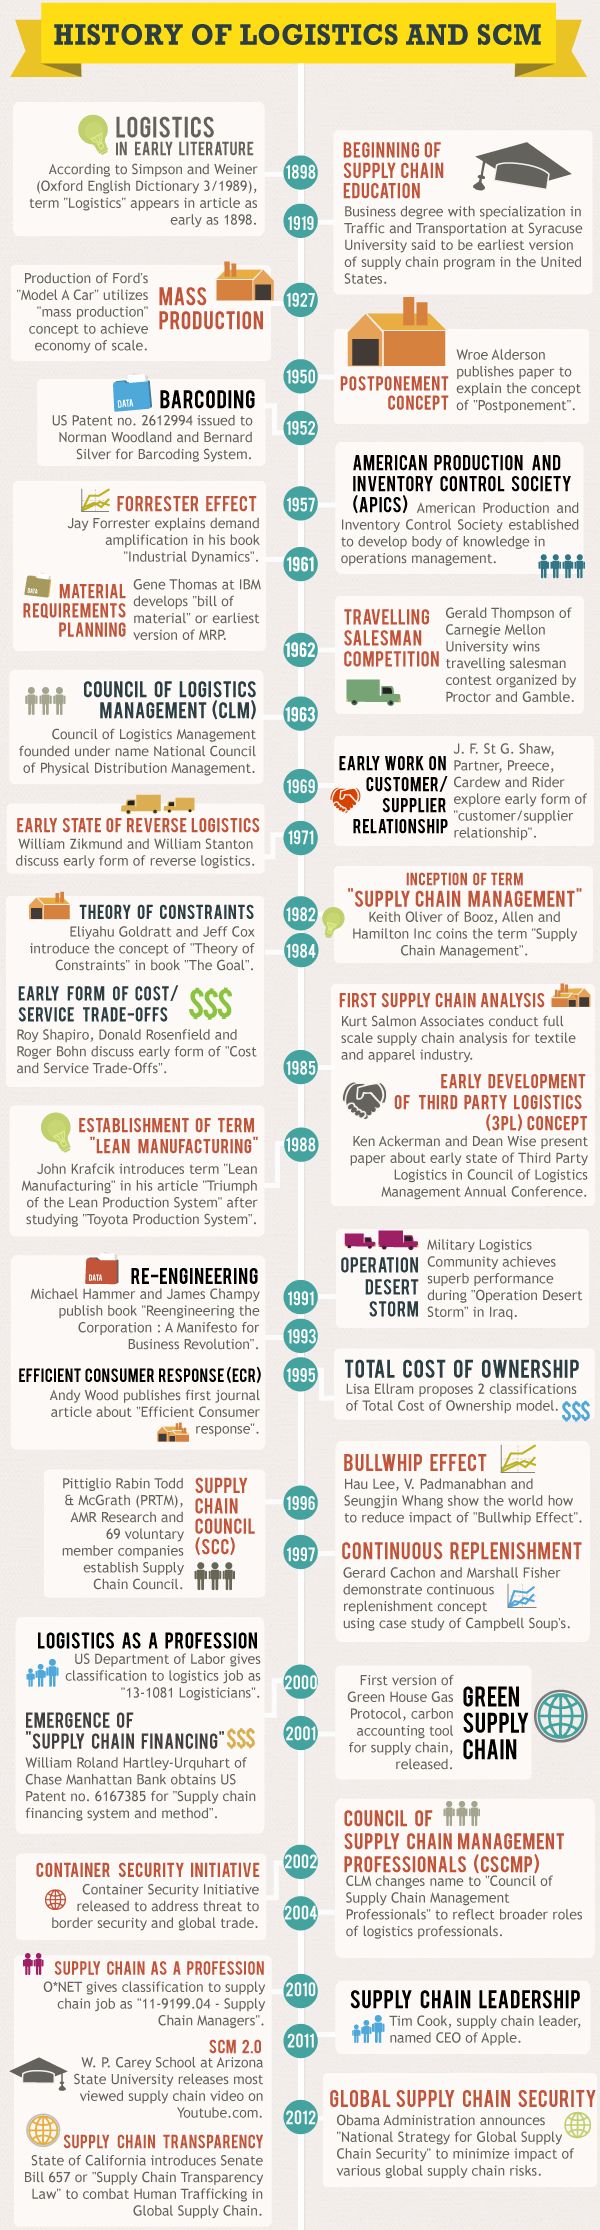
Supply chain resilience is a relatively new subject in supply chain management. During the 1970s, corporate decision making used traditional risk management techniques which have strong roots in financial models. Risks are usually quantified using assumptions based on historical data. In 1982, the term “Supply Chain Management” was coined by  a management consultant in the UK. The  primary goal of supply chain management was to reduce lead-time in distribution channel.

Risks in supply chains come in different terms– like variation, uncertainty, non-conformance, vulnerability and disruption. In the late 1990s, supply chain risk management emerged in academic literature. In 2000, research on the subject was conducted in the UK after transportation disruptions from fuel protests. Another research stream about resilience came in the United States after the 9-11 attacks in 2001. Then, in 2004, Martin Christopher and Helen Peck published their paper  “Building the Resilient Supply Chain.”  They defined resilience as “the ability of a system to return to its original state or move to a new, more desirable state after being disturbed“.

The most interesting year turned out to be 2011, with the tsunami in Japan followed by massive flooding in Thailand. The automotive and electronic industries were hit very hard by the disruptions. Since then, supply chain resilience has gain extraordinary attention from both academia and business professionals. The purpose of the Powerpoints I have created (click below) is to familiarize readers with the concept of supply chain resilience.  I hope this is something useful for instructors teaching from the Heizer-Render OM text.

[gigya id=”preziEmbed_n5tqhy_p-nhm” name=”preziEmbed_n5tqhy_p-nhm” src=”http://prezi.com/bin/preziloader.swf” type=”application/x-shockwave-flash” allowfullscreen=”true” allowFullScreenInteractive=”true” allowscriptaccess=”always” width=”550″ height=”400″ bgcolor=”#ffffff” flashvars=”prezi_id=n5tqhy_p-nhm&lock_to_path=0&color=ffffff&autoplay=no&autohide_ctrls=0″]
Source: SCM-Operations.com

Guest Post: Using MyOMLab for Online Teaching

Our Guest Post today comes from Dr. Chuck Munson, who is Associate Professor of Operations Management at Washington State University. His earlier blog for us was called “Spicing Up the Assignment Problem”.

I used to shy away from overload teaching opportunities for online courses because I initially hated the whole online teaching experience and was almost embarrassed to call it “teaching.” The availability of MyOMLab (with a little help from the bad economy) has changed my views.

While I believe that there’s still no substitute for the face-to-face learning experience, online education does help serve a niche of place-bound students. And for my operations management course, MyOMLab removes a lot of time and strain. The time that I used to spend grading can now be spent on responding to questions and providing information to students. For many of the problems, the built-in learning aids can answer a lot of the students’ questions. Also, the students really like the extra chances that they get to solve questions correctly. And I’ve  found the test bank questions to work well—it’s very easy to select questions, and the multiple-choice tests that I’ve given (open-book and 2.5 hours to solve 25 questions) usually provide a good grade distribution. The excellent company videos seem particularly useful in online environments.

Here are some unsolicited student comments regarding MyOMLab from my spring, 2012 online course:

 “Great information and I liked the OM lab.”

“I almost feel that I got more interaction in this online course than if I were in person in a large lecture hall. MyLab was also a great experience—much better than many sites I have used during my WSU Online time.”

“The MyOMLab was crucial for success in learning the formulas for calculations.”

“Excellent—couldn’t have been better.”

“In the case of this class, the online environment works very well. The assignments and MyLab learning were both great, and I learned a lot.”