Teaching Tip: iPad, I Saw, I Waited–The State of E-Texts

The article by this title in Wired Magazine (Aug.26, 2011)  just caught my eye, as Jay and I have been closely watching the role of e-texts for well over a decade. Surprisingly, there has been very little traction during this period, with sales of the e-versions of our OM books still hovering around the national average of 10%. Wired predicts that there will be little change any time soon, and puts e-text sales at $585 million by 2013–just 11% of all text sales.

How can this be when 27% of college students surveyed think their laptop is the most essential item in their bag?  Further, almost 75% say they wouldn’t be able to study without some type of digital technology. But here is the bad news from Wired for us as OM instructors: “Nearly 2 in 5 say they are unable to go more than 10 minutes without checking one of their digital devices”.

To answer the first part about e-text sales, Wired thinks : (1) students are smart and have figured out that buying a book–new or used– and then reselling it is still a good deal; and (2) everyone is still waiting to see around which platform the  major publishers will coalesce. As e-texts become more dynamic,  full of audio-visual content, and internet-connected, the question will be whether your e-text will work on your Kindle as well as your laptop? What about on the HP Touchpad that I just picked up this week for $100?

Now, about the second issue– of students focusing not on you, but rather on their freedom to multitask with their technology during lectures? Here is how Jay and I can  help: (1) Try showing some of our 31 video cases —  5-12 minute company inside views that tie directly to each chapter’s topics; (2) Use some of the 2,000+ PowerPoints we created to power up your lectures (with suggested comments on each in our Instructor’s Resource Manual); and (3) Experiment with some of the class exercises we describe in this blog under the Teaching Tips section.


Teaching Tip: Texas Has Location, Location, Location

Of our 100’s of blogs over the past year, the second most widely read one has been on why firms choose to locate in Louisville.  (The first is on “Bottlenecks in Intensive Care Units“). But The Wall Street Journal (Aug.22, 2011) tells why Texas is giving Louisville and Kentucky  a run for their money.  Here are some advantages that other states would be hard to match: convenient location in the middle of the country, transportation hubs, a big bilingual population, mild winters, and abundant space. And as Texas’ governor (who is running for President) trumpets: “no personal income taxes, relatively light regulation, laws that restrict labor unions’ power, and a welcoming attitude that eases the transition”.

“When you put it all together in its totality…that’s what made Texas stand out”, adds the GM of Medtronic, whose firm decided to locate its 1,400 job diabetes center in San Antonio. Of the 900 cities the med tech company explored, 3 of the top 5 choices were in Texas. “The state offers short flights to both coasts, a bounty of qualified workers at a reasonable cost, and a team of local and state economic developers to help jumpstart  operations”.

Texas has gained over a million jobs since 2000, while the US has lost 1.3 million in that period. The private health care and private education expanded by 40% in the decade, public education jobs by 24%, and the mining sector by 67%.

The state is unusual in many ways– covering an enormous swath of land, with a huge and growing population that provides both an ample work force and a robust demand for goods and services. When we discuss location decisions in Chapter 8, we see that financial  incentives are often not as critical as a healthy business environment.

Teaching Tip: Myomlab Improves Learning (and evaluations)

I have just completed 5 days at the 2011 Academy of Management meeting in San Antonio where activities began at 7am and went well into the evening. And almost 8,000 people were on the program! The OM division alone has 722 members. I met with many colleagues who are using the Heizer / Render text, some with and some without the myomlab option. Therefore, as we begin this semester, I want to encourage those who are not using myomlab to do so.  The students love it. They learn more. And your evaluations go up. Those are real payoffs.

Myomlab, which Barry and I have been refining for several years, is now a mature product. Additionally, Pearson continues to enhance the underlying platform with more options. Myomlab includes the end of chapter problems, as well as the T/F and multiple-choice questions from the text bank. The result is  a very rich set of exercises that allows you to focus on the topics and style of class you want to teach.  Additionally, Howard Weiss has enhanced the POMs for Windows software and Excel templates  with a ‘cut and paste’ feature that facilitates easy transfer of problem data into those software packages. Howard particularly likes this feature because it allows him to assign many problems and devote more class time to interpreting results.

Use of myomlab also opens up some book options that can reduce cost to the student. Your sales rep or our editor Chuck Synovec (chuck.synovec@pearson.com) can tell you more about the various options. Pearson also has talent available to aid you with any coaching you may want when starting and using myomlab.

Teaching Tip: Learning Curves and the Boeing 787

I first heard of the importance of learning curves when working at McDonnell Douglas right out of college during the peak of the Viet Nam War. While I toiled designing the wing of the DC-10 jumbo jet in the basement of the St. Louis plant, over 30 F-4 Phantom jets were rolling off the assembly line on the ground floor per month. Each one took less time than the one before it–and we could compute to the hour how long completion would take, as the learning curve effect is well-known in the airplane industry (see Table E.1 in Module E of OM, 10th ed.).

But the F-4 is old news and we want to provide you with a more current example. Businessweek (Aug.23-30, 2011) tells the story of Boeing’s Dreamliner 787, the world’s fastest selling jet, racking up more than 800 orders before  it even flew. The planes have an average “catalog price” of $202 million, and Boeing plans to assemble 10 a month by 2013– a record for wide-body jets.

But here comes the bad news. As you know, Boeing is running 3 years behind schedule because of supply chain problems (that we have blogged about several times). The company has amassed $16.2 billion worth of inventory in the form of 35 almost-finished  jets  scattered at parking spaces from Washington to Texas. Some are waiting for seats, some lavatories, and others engines. Boeing has spent an average of over $250 million to build each of the 44 planes it has “completed” so far.  The 45th plane will cost $184 million. To reach a break-even point at 1,000 planes, the unit cost must drop to $113 million. And this can only be accomplished with a very aggressive learning curve of 76%.

Based on the plane (no.45) currently being completed, the rate sits at 82.5%, not far from the 84% learning curve the Boeing 777  jumbo jet  has followed. At this rate, the loss will be $4 billion per year through 2015. Is the learning curve critical to Boeing? Absolutely!

Teaching Tip: Helping Your OM Students Find Jobs with Business Analytics

Just a day or two ago, I got a nice email from our colleague Barry Spraggins, who is Chair of the Managerial Sciences Department at the University of Nevada-Reno.  Barry uses our text Operations Management, 10th ed.,  and noted that he teaches heavily from all the Quantitative Modules, including Decision Making Tools (Module A), LP (Mod. B), Transportation (Mod.C), Queuing (Mod.D), Learning Curves (Mod.E), and Simulation (Mod.F). He writes: “I still think these are relevant components”. Not by coincidence, we find that The Wall Street Journal (Aug. 4,2011), Jay and I,  and IBM all agree.

The Journal reports that finding qualified graduates in business analytics has proven difficult–and colleges are finally stepping up to meet industry demand. IBM, which spent more than $14 billion since 2005 to buy a flock of analytics companies, has now teamed up with over 200 colleges to develop analytics courses. Fordham and Indiana U. are unveiling analytics curricula, as well as certificate and degree programs. Indiana, for example, is offering certificate programs in business analytics to both Deloitte and Booz Allen employees. Fordam has a required course called Marketing Analytics for MBAs. U. of Virginia, also working with IBM, is introducing an analytics track this fall.

“Analytics is certainly one of the top five things executives are worried about and investing in heavily”, says the president of Teradata. “Industry is going to demand it. Students are going to demand it”. As IBM and other big firms drive the software implementation process to the board room, we in academia may very well see a resurgence of demand for the very topics Prof. Spraggins has long espoused. In a tough job market, this is one way to help our students gain competitive advantage.

Teaching Tip: Using Prisons to Teach Design Capacity

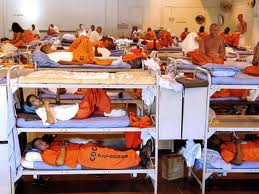
The Wall Street Journal (June 18-19,2011), of all places, provides a great classroom example on the subject of capacity ( Supp. 7). The context is the California prison system, which was just ordered by the Supreme Court to reduce its prison population to 137% of capacity, citing unsafe overcrowding. Since capacity usually refers to the maximum number of units that can be produced or contained in a specific time (see our definition in Supp.7), it’s hard to comprehend filling a space beyond 100% of that limit.

 But the Journal writes that “the numbers on California’s prison overcrowding were based on its penal system’s design capacity. The state traditionally planned for prisons to hold one inmate per cell. But most facilities doubled their population almost immediately after opening because of a glut of inmates. The state claims that it has recently reduced its prison population to 179% of capacity.

California also measures its prison system by operational capacity, or the number of prisoners who can be housed given actual conditions at prisons. Because of double-bunking, the operational capacity is almost twice the design capacity, meaning the system was able to claim to be only 9% above operational capacity in 2009. (The courts rarely recognize this measure). Adding to the confusion, a 3rd measure, rated capacity, based on fire marshals’ assessments of how many prisoners can be housed safely, is also used in some states.

The prison example provides an interesting contrast to our more traditional discussion of bakery capacity in Example S1.

Teaching Tip: What Can You Expect From Your Hotel?

When you are teaching  TQM in services (Ch.6), you might ask your students to consider how they would rate the quality of hotels they have stayed at. We write in the chapter about the intangible differences between products (hotels) and the intangible expectations customers have of these products. Certainly, we all have lower expectations of service quality when we stay at a Motel 8 versus when we are guests at a Ritz Carlton or Four Seasons. (See in our video case study “Quality at the Ritz”).

I bring this up because my family and I  just returned from our big vacation of the summer– a 3-night stay at what some claim to be the premier resort hotel in the Caribbean. The “product” was really on the  expensive side, so our expectations ran high. World class facilities, food, service, and activities were all on the list.  The people/services were extraordinary. Every single employee we came in contact with was gracious, smiling, helpful, and courteous.

But one of the reasons we came in contact with so many hotel staffers was that so many things went wrong with the tangibles. My wife counted over a dozen repair people (all warm and friendly) in our rooms during the 3 days– yet the problems kept coming. First the broken shower head was replaced. Then a deadbolt that locked my 13-year-old in and us out (which had to be drilled out). Then no sound on the TV, as well as a missing remote. To boot, the sink was dirty (brown) when we arrived. But the real issue was the unflushable toilet! After 4 visits to first replace the insides, then to repair it over and over, the toilet still ran all night long. I worked on it myself a few times, then gave up and put 4 towels and a bathrobe over it to mask the noise.

How did the manager handle service recovery? The LEARN routine was followed perfectly, and a discount was even applied. But would we return to a hotel that had such problems? Very doubtful.

Teaching Tip: The Demise of the Text E-Reader?

Just a few months back, we wrote a blog about how students were simply not interested in e-books. The electronic version of our OM texts has been available for well over a decade, but research has shown that students, by far, still want to own a real book. Maybe it was because a great e-reader was still not available? We thought the Kno was the answer–a dual screen reader that allowed students to take notes on the pages–and in our blog showed a flashy video of how it worked.

But in the past few weeks (see Mind/Shift,  June 1, 2011), two manufacturers of tablet e-readers ceased production—the enTourage eDGe and the Kno! Both products were squarely aimed at the educational text market, having inked a number of deals with major book publishers. Despite their innovative 2-screen design, both machines were criticized for being clunky, too heavy, and too expensive (the Kno was $399-$599). Was it a matter of dual screens or was it because the devices were aimed at college students?

Ownership of tablets and e-readers remains low among high school seniors and college students,– just 4% and 7% , respectively. Do future buyers want an education-oriented tablet? Or will they buy a consumer-oriented tablet like an iPad or an Android tablet–then load it with e-books? While experts have predicted that 2011 would be the year of the tablet, the demise of the Kno and the eDGe raises some issues about students’ main source of learning being from an e-reader.

Guest Post: Spicing Up the Assignment Problem in Class at Washington State U.

Chuck Munson is Associate Professor of Operations Management at Washington State University. He is also the author of the Instructor’s Resource Manual for our OM texts. Here Dr. Munson describes an interesting class exercise for Ch.15.

In an attempt to generate student interest in the assignment problem, I recently created a little in-class exercise called “Celebrity Apprentice,” where the task for the students was to assign each member of a celebrity team to a specific task for a rich potential client. The goal was to secure business from this client, who’s managers are accustomed to responding positively to bribery and favors. The six tasks were: (1) handle the money, (2) take the managers to a bar and drive them home, (3) sing to them in a private concert, (4) take them golfing, (5) locate female escorts for the managers, and (6) negotiate the contract. The six celebrities on the team were: (1) Lindsey Lohan, (2) Tiger Woods, (3) Mel Gibson, (4) Lady Gaga, (5) Charlie Sheen, and (6) Chuck. (By inserting yourself in the list, you can provide several self-deprecating remarks that the students may enjoy regarding your respective abilities to perform tasks.)

When I tried the exercise, the students laughed a lot, and they enjoyed shouting out ratings and arguing with each other about the scores. Some tasks led to ambiguous ratings, depending on the celebrity. For example, for the “take them to the bar and drive them home” category, certain celebrities might be rated high based on their respective partying skills; however, several of the same celebrities have been picked up for drunk driving or even getting into car accidents while drunk. So what rating would be appropriate? In some cases, the instructor can even assign ratings outside of the normal range for extreme fit or lack thereof (again, this is where self-deprecating remarks can draw some laughs). The students seemed to get a kick out of the whole thing, and I expect to repeat this exercise in the future. If you try it, have fun! The possibilities are only limited by your imagination.

Teaching Tip: The World’s Most Admired Companies–2011

In reading Fortune’s new 2011 list of the “50 most admired companies” in the world, I saw some good teaching opportunities. Of the nine attributes rated by the 4,100 execs who did the rankings, I would view six of them as being under the OM purview. (The rest are financial measures). And what makes the rankings more interesting is that Fortune points out the major changes since their pre-recession survey 4 years ago.

Here are the  6 categories, along with the old and new champs for each:

1. Ability to attract/ keep talented people:  then, GE: now Goldman Sachs.

2. Global business effectiveness: then Nestle: now McDonald’s

3. Quality of management: then P&G: now McDonald’s

4. Quality of products/ services: then Anheuser-Busch: now Amazon.com

5. Sustainability: then UPS: now Statoil

6. Innovativeness: then Apple: now Apple

Two things we can discuss with our students: (1) McDonald’s is considered the world’s best-managed company on 3 attributes (the last being wise use of corporate assets). Can the class explain why? (2) Only Apple preserved its status (for innovativeness) over the 4 traumatic years. And Apple ranks no.1 in the Fortune overall most admired list.

A wonderful editorial recently in The Wall Street Journal (April 12,2011), by Vinton Cerf (an Internet pioneer now at Google), explains Apple’s success. He writes: “Americans get very excited about innovation…In Silicon Valley, and elsewhere in the US, the engine requires sources of trained professionals, sources of capital, and new and exciting companies that form a mutually enforcing ecosystem”.

Contributing factors, Cerf adds, include the freedom to pursue ideas, the freedom to fail, and freedom of access to information. “Business failure in the US is a mark of experience”. I am reminded of a recent interview of Stephen Jobs who remarked that being fired from Apple by John Scully (in 1984) was the best thing that ever happened in his career. (He came back as CEO in 1997). In other cultures, such a downfall would be a permanent scar.

Teaching Tip: Why Did the Chevy Steering Wheel Fall Off?

Imagine speeding along the roadway in your brand new 2011 Chevy Cruze, turning your car’s steering wheel, and the wheel breaks off from the steering column!  It’s an interesting story (in The Wall Street Journal, April 10,2011) that certainly ties in with our discussion of quality in Chapter 6. 

Of course, it’s every driver’s nightmare, but in particular to the person who it happened to a few weeks ago. As a result, GM is recalling 2,100 new cars and facing an unwelcome development while it rides high on the compact Cruz’s sales success.

According to the NHTSA (Nat’l Highway Transportation Safety Admin.), the wrong wheel was put in this particular car, then replaced later with the correct one. But the new wheel was not attached properly.

This raises some good issues to discuss in teaching quality in class. First, how did the wrong wheel end up on the assembly line? (JIT delivery gone awry?  What was the root cause of this defect?) 

 Second, why was it that a wrong wheel could fit on the column? (No poka-yoke system in place?)

 Third, was there no Andon call signal to alert supervisors that such a problem had popped up? (Could it have happened before and no one pointed it out?  Had it happened at a different plant? Is there a struggle to change from the old Detroit mentality that the line should never be stopped?)

Chevrolet says “it has changed the production process to make sure the machine used to attach the steering wheel can accommodate only the correct one”.  I like this story because it raises several teachable issues.

Teaching Tip: Measurements That Mislead

Today’s Wall Street Journal (April 2-3,2011) has a wonderful article on the subject of work measurement (Ch.10). The question of how to deal with employees who know they are being observed for a time study arises in every class I teach.  About 30 years ago, Prof. Paul Sackett, at the U. of Minnesota, began timing the speed of supermarket cashiers ringing up a few dozen items. He found (unsurprisingly) that some were faster than others. All knew they were being observed. Today, with electronic scanners recording the pace of workers over long periods of time, it is once again clear that productivity varies greatly.

Sackett assumed these separate measures (short-time observed and longer-period with no observer) would generate similar rankings. But they yielded very weak correlations. This led him to believe that there are highly motivated, focused people who perform well  when they know they are being tested for “maximum performance”.  On the other hand, “typical performance” (how well one does over the long haul) is influenced by a whole different set of character traits.

Think of the SAT,LSAT, or GMAT. They each take just a few hours (under maximum performance) and are supposed to give a reading of an individual’s talent. Though the SAT does a modest job of predicting grades for freshmen (R-squared=.12), it doesn’t do well at predicting post-college achievement. (Same for the LSAT).

“Even the NFL Combine is a big waste of time”, says the Journal. There is no consistent statistical relationship between how well players do at the Combine and how they succeed in the NFL. Grit, on the other hand, which reflects a person’s commitment to a long-term goal, does predict levels of achievement. (It seems like one needs grit to get a PhD) . But workers, football players, and students do not reveal their levels of grit when taking a brief test. What really matters, as we all know, is what happens after the test is over.

Teaching Tip: Globalizing our OM Classes

I’ve just returned from a trip to India and was again reminded not only how much the world’s economies are intertwined, but also that we need to be sure our students appreciate that economic integration. This is a shrinking world. For instance, while in New Delhi, Boston University was having Executive MBA presentations in my hotel. And GE Chairman Jeffrey Immelt was also in town holding GE’s Corporate Excellent Council meeting and talking about added investment in GE’s energy, aviation, and locomotive facilities as well as GE’s 30% growth in India. Warren Buffett was in Bangalore speaking at the Confederation of Indian Industries and then in New Delhi discussing growth of Berkshire Hathaway’s insurance business. Michael Dell, with eight data centers across India, was also in New Delhi reportedly reviewing performance and investment opportunities. Meanwhile, Sara Palin was speaking about the US economy at the India Conclave 2011 in Mumbai. And, of course, the Indian auto assembly plants of Honda, Toyota, and Suzuki were concerned about part shortages after the earthquakes in Japan.

As an aside, perhaps I should add that Bill and Melinda Gates were also in India and slated to meet with Buffett to recruit others to join them in their philanthropic activities.

As we put on our professor hats and ‘profess’, it is hard for us to overemphasize the global perspective our students need (and that we introduce in Chapter 2). Whether it is international economics, investments by GE,  Berkshire Hathaway, or Dell, automotive supply chain issues, or Boston University’s international education, we owe it to our students to ensure that they have an international perspective. The world is not flat, but it is getting there.

Teaching Tip: Computing Break-Even for an Airline Flight

 At what price does an airline break-even when it sells you a ticket to fly from Point A to Point B? It’s an interesting question and makes a good example for covering break-even in Supp.7 (see Figure S7.5).

Fortune  (March 23,2011) just provided an excellent analysis, along with an interactive pie chart that allows you to alter the price of fuel. It takes Delta’s flight from Los Angeles to La Guardia (NY), with a brief layover in Detroit, as its basis. With the average price of a one-way ticket (including 1st class) on this particular flight of $506, Delta was making a $33 profit per ticket in 2010. When fuel was pre-Mideast instability  jitters just a few months ago, $98 of the cost was in that one item, the largest of all costs incurred.

Today, the profit is down to $4! Fortune makes the point that if you fly coach on a competitive route, the carrier is probably in the red. (Hello baggage, pillow, and food fees).

Here is the cost breakdown: Labor ,$95; Plane rent/ownership, $26; Non-plane rents,$17; Nonemployee labor, $32; Payments to partners, $54; Interest, $12; Taxes/fees, $75; Other/misc., $63.

As the flight begins, with a 23 min. boarding time and a 24 min. taxi to the runway, Delta has already spent over $1,000 in labor, fuel, and maintenance. Flying to the layover in Detroit costs $11,674, and getting to the gate another $309.

I think using the interactive fuel price graph makes a point that any flying student will appreciate.

Teaching Tip: Using Real Data for Inventory

For lots of varied reasons many of us spend substantial class time on inventory. The Heizer / Render text covers inventory in Chapter 12 (managing inventory and inventory models), Chapter 14 (lot sizing), and Chapter 11 (measuring assets committed to inventory and inventory turnover). 

One way to engage students in discussions of inventory, and perhaps understand its significance better, is to have them use real turnover data for companies or industries they know.  We show how to do this in Chapter 11, Examples 5 and 6, where we use Home Depot and Pepsi data. Assignments where students compute and compare these ratios can be facilitated by the use of annual reports as most annual reports provide enough data for the calculations. Alternatively, data on an aggregate basis are available and down loadable from the U.S. Census Bureau.

Additionally, Quarterman Lee has just published some Wholesale Inventory Turn Data that you and your students might find interesting for developing industry comparisons.  His raw data are from the U.S. Census Bureau, but he has organized it into 18 broad categories and more than 260 subcategories. He has a modest fee of $6 or $8 to access the down loadable data.